
Fig. 5.
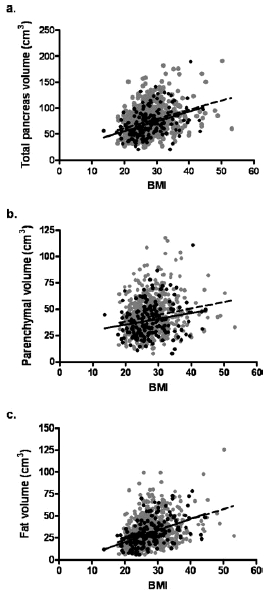
Relationship between BMI and pancreatic volumes. Despite considerable individual variance there is a significant relationship between BMI and total (a), parenchymal (b), and fat (c) volumes in nondiabetic subjects (gray dots, broken line) and subjects with type-2 diabetes (solid dots and solid line). The relationships are comparable in individuals with type-2 diabetes (T2DM) and nondiabetics (ND). (a) ND r = 0.3, P < 0.0001; T2DM r = 0.4, P < 0.0001, (b) ND r = 0.2, P < 0.0001; T2DM r = 0.2, P = 0.01, (c) ND r = 0.4, P < 0.0001: T2DM r = 0.5, P < 0.0001.