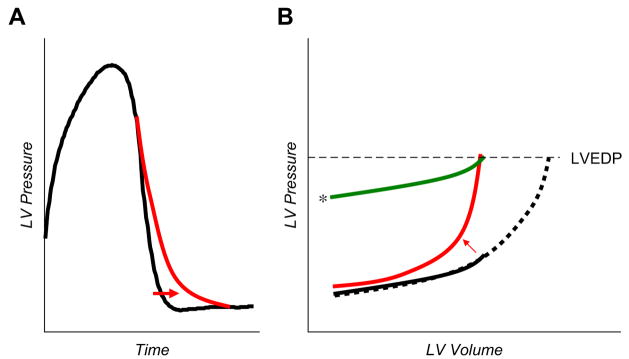
Fig. 2.
(A) The kinetics of LV pressure decay during isovolumic relaxation (the time between aortic valve closure and mitral opening) can be modeled by various equations to derive the time constant, τ. The curve indicated by the arrow shows prolonged relaxation, often seen with heart failure, aging, and hypertension. (B) Groups of DPVR. The solid black line shows the curve in a normal person. The curve that shifts up and to the left (arrow) indicates the effects of increased passive chamber stiffness. Filling pressures (LVEDP) may be elevated because of the increased passive chamber stiffness, but similar elevations also can be seen in the absence of increased stiffness, as when there is with increased extrinsic restraint (line indicated by the asterisk). Note that the shape (stiffness) of the DPVR with enhanced restraint is similar to that in the normal patient. Finally, EDP may be elevated simply because of the overfilling of a structurally normal ventricle (dotted black line). There is evidence to support each of these possible contributors to elevated EDP in HFpEF.

