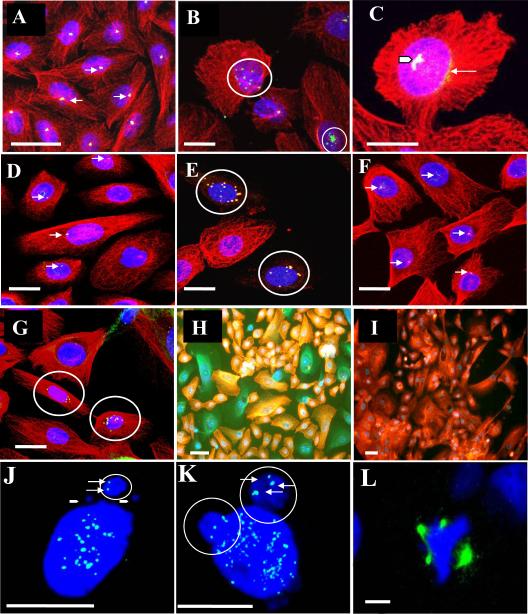
Figure 1. AZT-exposed CHO cells and, NHMEC strains visualized by confocal microscopy.
(A-C): CHO cells incubated with anti-pericentrin antibodies (green), anti-β-tubulin antibodies (red), and DAPI to stain DNA (blue). Co-localization of pericentrin and β-tubulin appears yellow. (A) Untreated cells. Arrows indicate the presence of centrosomes (B): CHO cells exposed to 400 μM AZT for 24 hr. Circles indicate: centrosomal amplification (top); centrosomal fragmentation multiple pericentrin-positive signals (bottom). (C): CHO cells exposed to 800 μM AZT for 24 hr. Arrow head indicates multiple coalescent pericentrin signals; thin white arrow indicates pericentrin aggregation. (D-E): NHMEC HI cells. (D): Untreated cells, arrows indicate centrosomes. (E): Cells exposed to 200 μM AZT for 24 hr, circles indicate 2 cells with amplified signal for pericentrin suggesting the presence of multiple centrosomes with co-localizing signal for tubulin. (F-G): NHMEC LI cells. (F): Unexposed cells, arrows indicate centrosomes. (G): Cells exposed to 200 μM AZT for 24 hr, circles indicate 2 cells with amplified signal for pericentrin suggesting the presence of multiple centrosomes and normal β-tubulin staining. (H): NHMEC HI cells, stained with anti-β-tubulin antibodies and rhodamine (red); some cells appear green due to the lack of rhodamine staining. (I): NHMEC HI cells, stained as in H but without triton extraction (soluble β-tubulin is retained in cells that have not undergone extraction). The tubulin staining red indicates that green cells in H contained un-polymerized β-tubulin. Bars = 10 μm. (J-L): Kinetochore staining with CREST antibody. (J): CHO cell, exposed to 800 μM AZT for 24 hr. Solid arrowheads indicate the presence of 2 small CREST-negative micronuclei, and a white circle indicates a large micronucleus with two CREST-positive kinetochores (white arrows) inside a large micronucleus. (K): NHMEC HI cells showing 2 large circled bodies on top containing kinetochore positive signals (arrows). (L): Triradial spindle revealed by the abnormal multipolar distribution of Aurora A, in a cell treated with 200 μM AZT for 24 hr; DAPI (blue) staining shows abnormal multipolar chromosomal distribution. Bars: J-K = 5 μm, L = 1.5μm,

