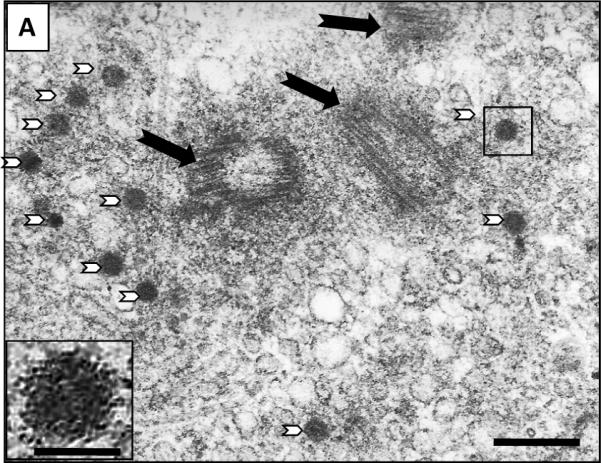
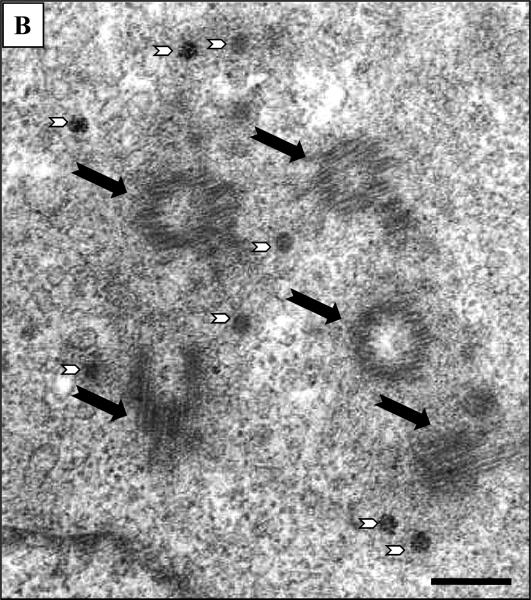
Figure 2. Electronmicroscopic images of CHO cells.

(A) CHO cells exposed to 400 μM AZT for 24 hr Black arrows indicate three centrioles in cross section or cylindrical and/or oblique orientation. Numerous small round electro-dense structures are also observed (white arrowheads). Insert: detail of small round electro-dense structure indicate by a box. (B) CHO cells exposed to 800 μM AZT centrioles indicated by black arrows and pericentriolar electro-dense bodies with irregular distribution are indicated by white arrowheads. Picture bars = 200 nm, insert bar = 70 nm.

