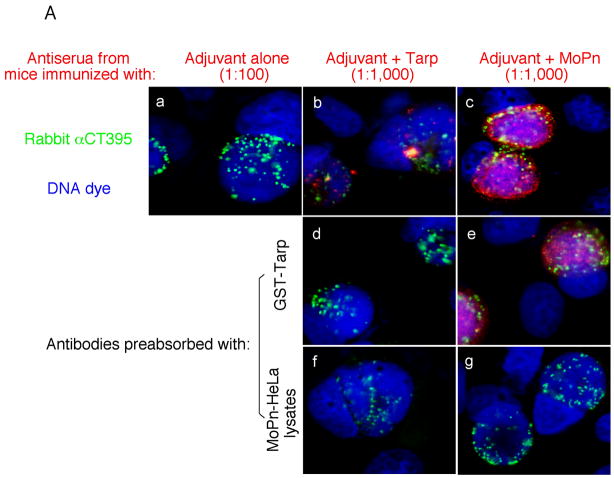
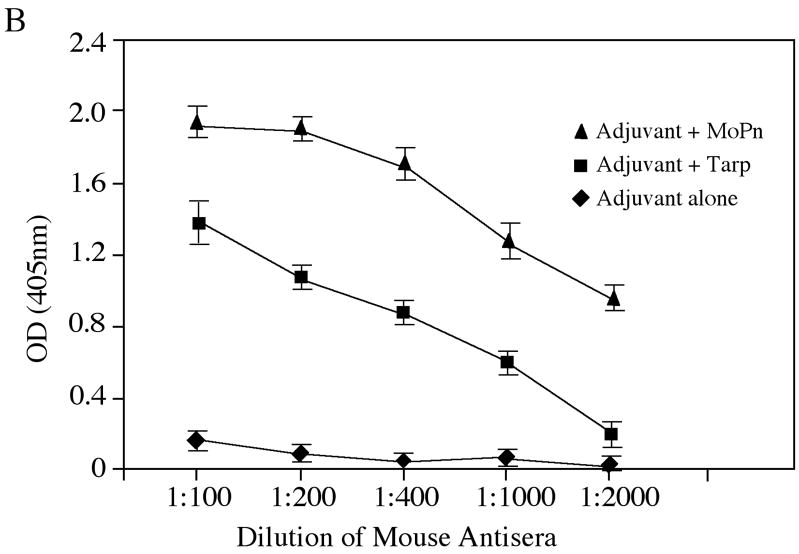
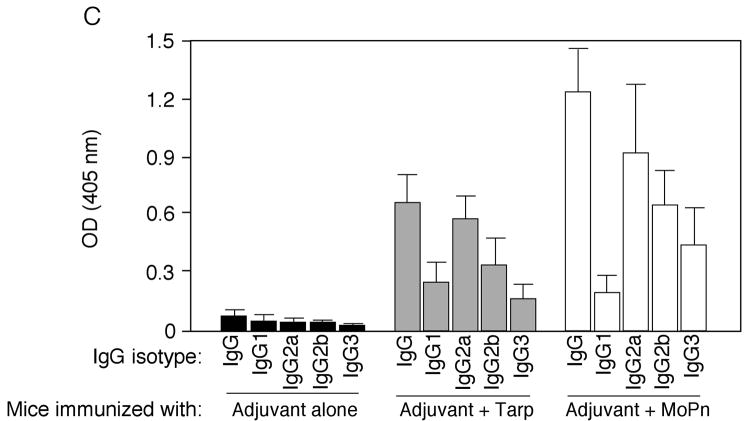
Fig. 6. Induction of MoPn-specific immune responses by Tarp immunization.
Sera were collected from three different groups of mice immunized with either the adjuvant alone (a total of 10 mice), adjuvant plus Tarp (9 mice) or plus MoPn (10 mice) on day 29 after the last immunization. The sera from each group were pooled and used to detect the endogenous antigens in MoPn-infected cells using an immunofluorescence assay (A) or ELISA (B). For the immunofluorescence assay, the MoPn-infected cells were costained with the mouse antisera (red) as indicated on top of the figure, a rabbit anti-chlamydial organism antibody (aCT395; green) and a DNA dye (blue). To confirm the staining specificity, the antisera from the Tarp and MoPn-immunized groups were preabsorbed with either GST-Tarp or MoPn-infected cell lysates prior to the staining as indicated at the left side of the figure (panels d–g). For ELISA titration of the antibody titers, the MoPn-infected HeLa cell lysates were coated onto microplates and the serially diluted antiserum samples pooled from each group of mice (shown along the X-axis) were applied to the plates. The antibody binding was detected and expressed as OD values as shown along the Y-axis. The ELISA was repeated three times with duplicates in each. (C) The IgG antibodies from each individual mouse of the three groups (adjuvant alone, solid bar; adjuvant + Tarp, gray bar; adjuvant + MoPn, open bar) were further isotyped using the ELISA as described in the legend of panel B above. All mouse antisera were diluted 1:1000 and the titers of the total IgG and each IgG isotype as indicated along the X-axis were measured as OD values at 405nm as displayed along the Y-axis. The results were expressed as mean plus standard deviation.


