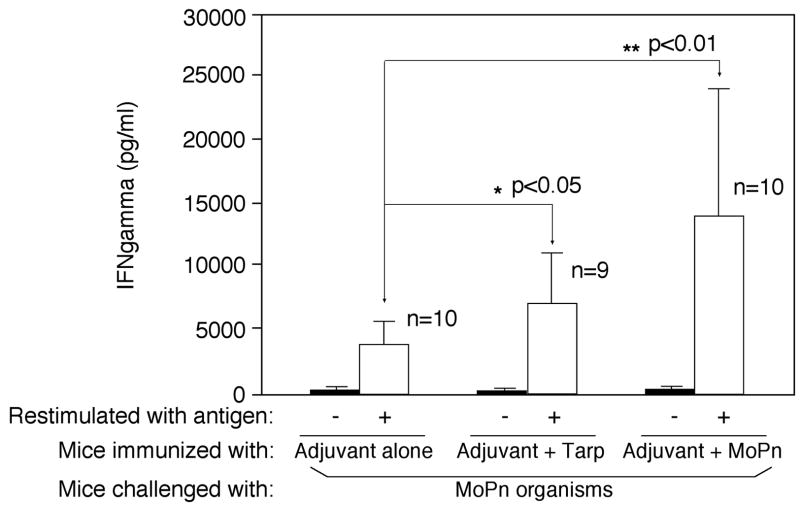
Fig. 7. Induction of MoPn-specific cellular immune responses by Tarp immunization.
The three groups of mice described in the legend of Fig. 6 were intravaginally infected with MoPn on day 30 after the final immunization and 60 days after the infection, the mouse spleen lymphocytes were collected for monitoring cellular responses to MoPn antigens by using an in vitro restimulation plus cytokine detection approach as described in Fig. 5B legend. The lymphocyte cultures from the three different groups of mice were stimulated with (open bar) or without (solid bar) UV-inactivated MoPn EB organisms at 1 × 10⁶ IFUs/well as indicated along the X-axis. Three days after the stimulation, the culture supernatants were collected for IFNg detection in an ELISA and the results were expressed as pg/ml as listed along the Y-axis (mean ± SD). The number of mice in each group was indicated in the figure. Note that although all three groups of mice produced significant levels of IFNg due to MoPn infection, immunization with either MoPn or Tarp significantly enhanced IFNg production upon MoPn restimulation.

