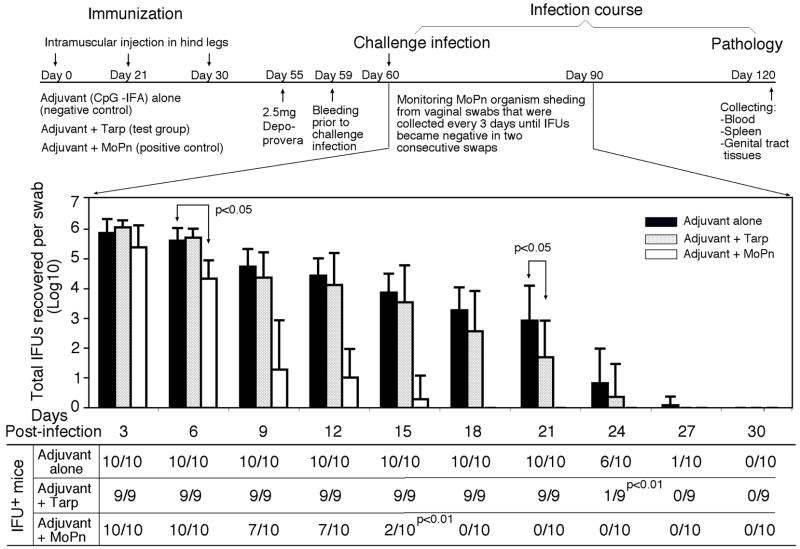
Fig. 8. Effect of Tarp immunization on live chlamydial organism shedding following chlamydial infection.
The three groups of mice described in the legend of Fig. 6 were intravaginally infected with MoPn organisms on day 30 after the final immunization and vaginal swabs were taken along the infection course and on day 60 after infection, all mice were sacrificed (flowchart on top of the figure). As indicated along the X-axis, vaginal swabs were collected every 3 days after MoPn infection for measuring the number of live organisms as inclusion forming units (IFUs). The IFU from each swab was converted into Log10 and the Log10 IFUs were used to calculate mean and standard deviation (mean ± SD) for each mouse group at each time point as presented along the Y-axis. The log10 IFUs were compared between the three groups of mice at each time point using the ANOVA Test and a two-tailed Student t Test was used to further analyze the significance between the Tarp- or MoPn-immunized and the adjuvant alone control group. The number of mice with detectable IFUs from each group and at each time point is listed in the chart at the bottom. The rates of IFU positivity were compared between the immunized and the adjuvant alone groups using a Chitest. The statistically significant differences were indicated in the figure and note that the Tarp immunization significantly reduced the level of IFUs on 21 day and the number of IFU positive mice on day 24 after infection although the MoPn organism immunization was much more robust in shortening the infection time course.

