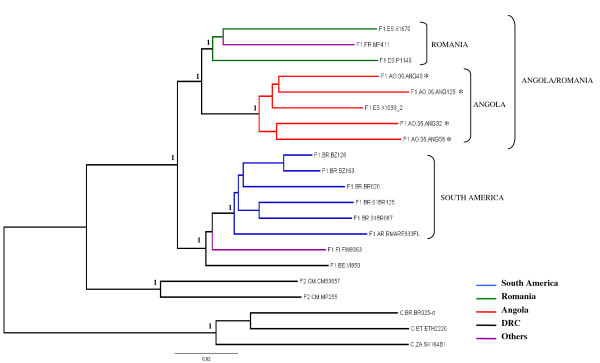
Figure 3.
Majority-rule Bayesian consensus tree of HIV-1 subtype F1 near full-length (~8.5 kb) strains. Posterior probabilities are shown for key nodes. The names of HIV-1 isolates include reference to subtype and country of isolation. The color of each branch within the subtype F1 cluster represents the country (or geographic region) of origin of sequence corresponding to that branch, according to the legend in the figure. The asterisks points at the subtype F1 Angolan sequences described in the present work. Brackets mark the different subtype F1 monophyletic clusters identified. Subtypes F2 and C reference sequences were used as outgroup. Horizontal branch lengths are drawn to scale with the bar at the bottom indicating 0.02 nucleotide substitutions per site.

