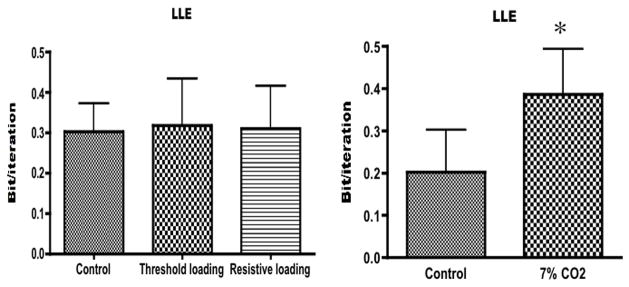
Figure 4.
Left panel: mean value ± SD of the largest Lyapunov exponent (LLE) during unloaded breathing (control), threshold loading and resistive loading. There was no significant difference between the three conditions (ANOVA, p=0.9502). Right panel: mean value ± SD of the largest Lyapunov exponent during room air breathing (control) and breathing a gas mixture of 7%CO2–93%O2 (7%CO2). *indicates a significant difference (t-test, p=0.0009

