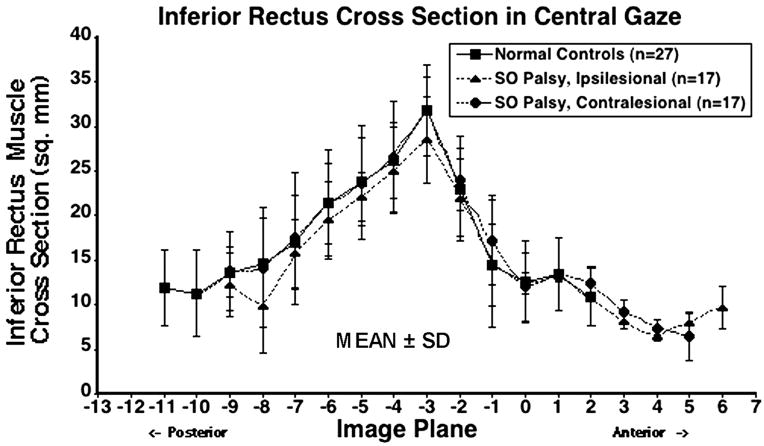
Figure 5.
Mean inferior rectus (IR) cross-sectional area in central gaze for 27 normal control muscles, 17 ipsilesional, and 17 contralesional IR muscles. Cross-sections are plotted as functions of 2-mm thickness image plane number, referenced to image plane 0 at the globe–optic nerve junction in central gaze. SD=standard deviation. Ipsilesional IR cross-section was significantly smaller than contralesional (P < 0.001) and was slightly, though significantly, smaller than normal (P = 0.043). Contralesional IR cross-section was slightly but not significantly larger than normal (P = 0.875).

