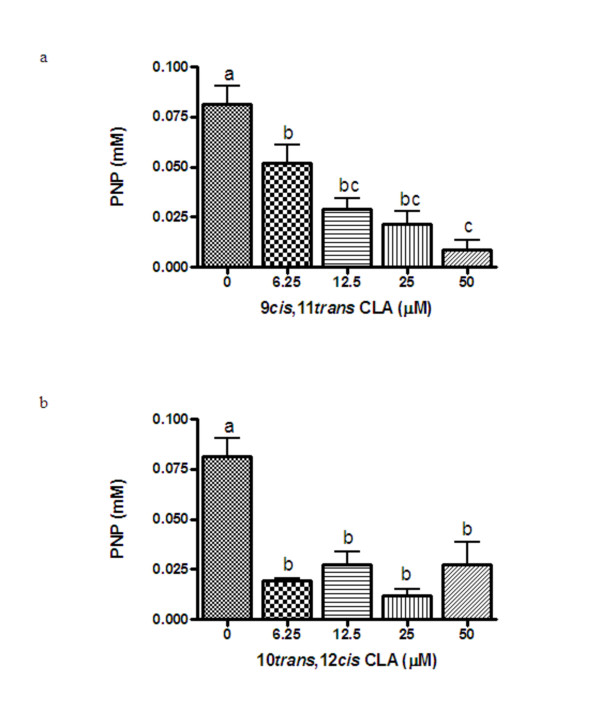
Figure 2.
Effects of increasing concentrations of 9,11 (Figure 2a) and 10,12 (Figure 2b) CLA on TRAP released into the media from CD14+ monocytes on day 14 of treatment. Values (n = 4) are expressed as the mean ± SEM of one experiment and the results have been replicated in a second independent experiment. Bars with different letters have significant differences at P < 0.05.

