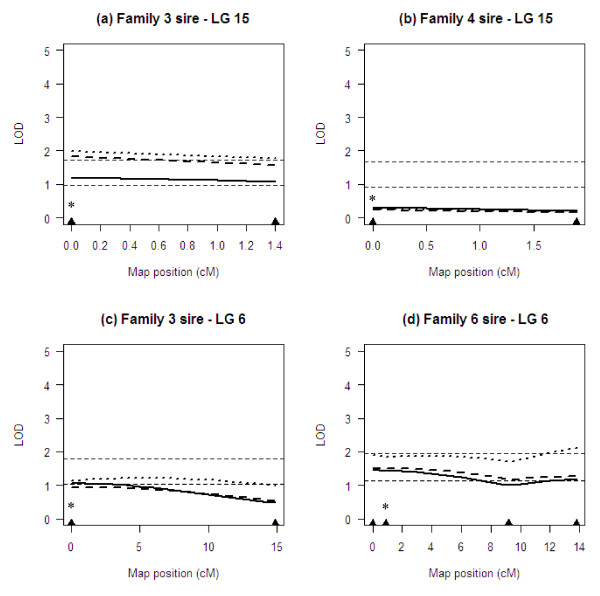
Figure 3.
Sire-based QTL scans of LG 6 and LG 15 for lice abundance. Multipoint LOD score profiles were generated using alternative covariate parameters for the effect of putative sex on lice abundance (solid line: no effects; dashed line: additive effects; dotted line: interactive effects). Triangles along the x axis indicate marker positions. Asterisks show the location of UBA and DAA on LG 15 and 6, respectively. Horizontal lines across each plot indicate LOD significance thresholds (lower threshold: chromosome-wide significance; upper threshold: experiment-wide significance).

