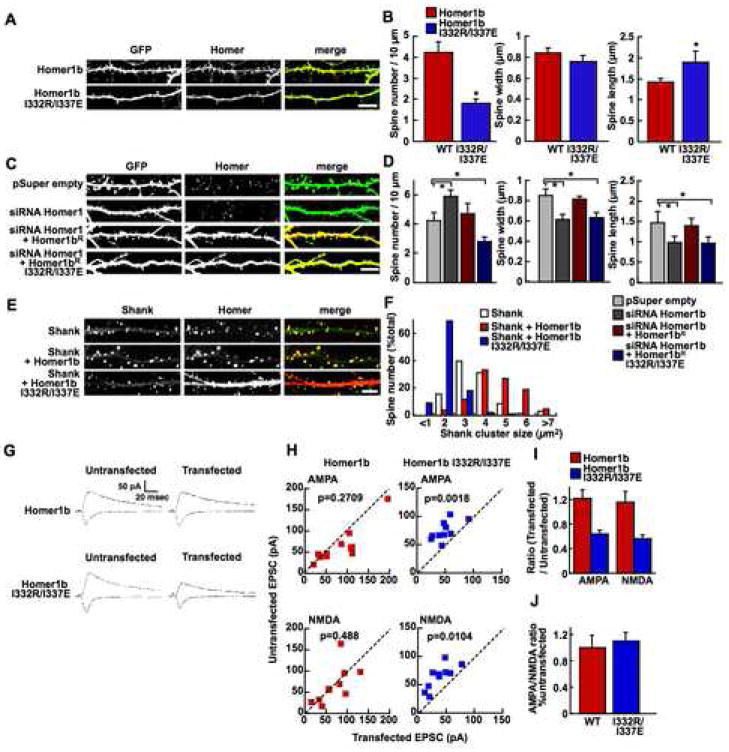
Figure 6. Effect of the dimeric mutant form of Homer on dendritic spine structure and synaptic transmission.
(A, B) Morphological analysis of dendritic spines expressing Homer1b or Homer1b I332R/I337E using the cytosolic GFP expression. Representative images of hippocampal cultured neurons transfected with myc-Homer1b or myc-Homer1b I332R/I337E and GFP (A) and summary (B). The neurons were stained with anti-myc antibody. *: p < 0.05 by T-test. Data were obtained from 5310 (WT, 8 cells) and 1596 (I332R/I337E, 9 cells) dendritic spines. Scale bar, 10 μm.
(C, D) Morphological analysis of dendritic spines expressing GFP and pSuper empty, GFP and expression vector for siRNA against Homer1b (pSuper-Homer1b); GFP, pSuper-Homer1b, and wild type Homer1b with mutation that makes it resistant to siRNA (Homer1bR); or GFP, pSuper-Homer1b and Homer1bR with I332R/I337E mutation (Homer1bR I332R/I337E). The neurons were stained with anti-Homer1 antibody. (C) Sample images. (D) Data were obtained from 3433 (pSuper empty, 6 cells), 4560 (siRNA Homer1b, 6 cells), 4989 (siRNA Homer1b with Homer1bR I332R/I337E, 9 cells), and 5633 (siRNA Homer1b with Homer1bR, 9 cells) dendritic spines. Scale bar, 10 μm.
(E, F) Coexpression of Shank with Homer. The neurons were stained with anti-Shank or anti-Homer1 antibodies. (E) Sample images. (F) Data were obtained from 804 (Shank only, 6 cells), 852 (Shank and Homer1b, 6 cells), and 920 (Shank and Homer1b I332R/I337E, 10 cells) dendritic spines. Scale bar, 10 μm.
(G–J) Synaptic response from pairs of untransfected control cells and cells transfected with either Homer1b or Homer1b I332R/I337E. (G) Sample traces. Stimulation artifacts are truncated. (H) For each pair of cells, the amplitude of AMPA-R or NMDA-R EPSCs from transfected cell is plotted against that of control cell. Homer1b, AMPA-R, n=11; NMDAR n=10; AMPA-R/NMDA-R ratio n=10. Homer1b I332R/I337E, n=10 for each measurement. (I) The ratio of amplitude in transfected cells/untransfected cells. (J) The AMPA-R/NMDA-R-EPSC ratio normalized to the untransfected cells.

