
Figure 7. The model of interaction between Homer and Shank.
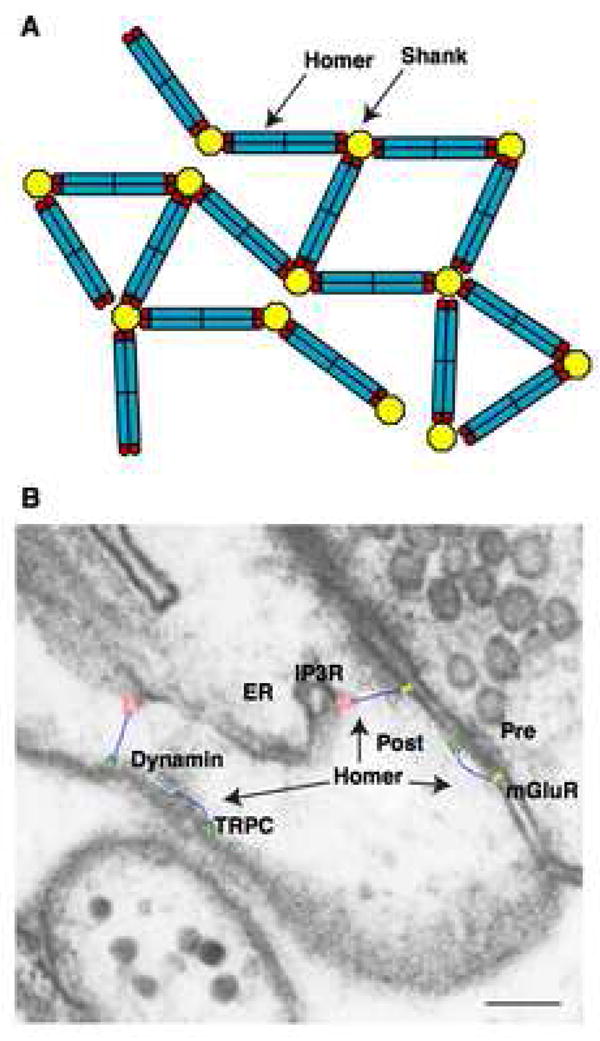
(A) A model of high-order complex between Homer and Shank. Currently, the oligomeric status of Shank is not known.
(B) Overlay of the structural model of Homer (blue) on the PSD. The structures of mGluR1 (yellow) is modeled based on the structure of mGluR1 extracellular ligand binding domain (Kunishima et al., 2000) and the structure of rhodopsin (Palczewski et al., 2000). The structures of IP3R (red) (Sato et al., 2004), TRPC (green) (Mio et al., 2007) and dynamin (Mears et al., 2007) are taken from electron microscopy images. All structures are depicted to scale on an electron microscope image of a hippocampal CA1 spine with smooth endoplasmic reticulum, obtained and modified from Spacek et al. (1997). Copyright 1997 by the Society for Neuroscience. The presynaptic terminal (Pre), postsynaptic terminal (Post) and endoplasmic reticulum (ER) are indicated. Scale bar = 0.1 μm.