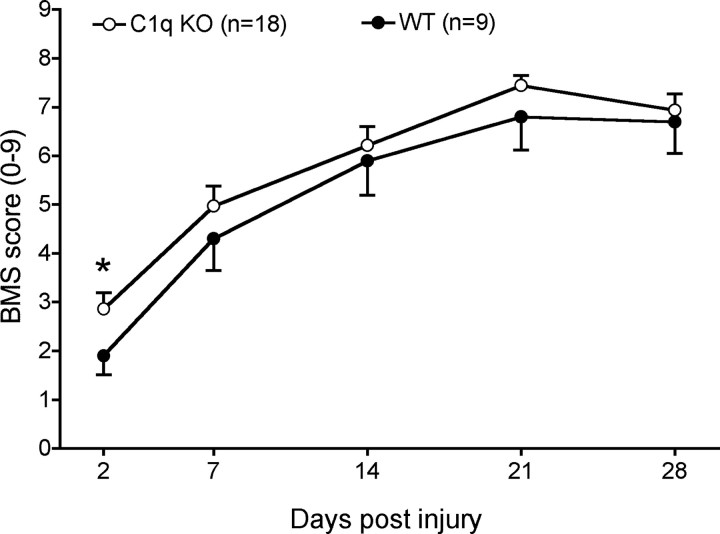
Figure 2.
BMS recovery curves illustrate the extent of gross functional locomotor recovery in C1q KO and WT mice following a mild contusion injury. Repeated measures ANOVA analysis showed that locomotor recovery was not significantly different between groups over time (p > 0.05). Additional comparisons revealed that C1q KO showed improved recovery compared with WT mice 2 d post-injury (Student's t test, *p < 0.05). Data points represent group means ± SEM.

