
Figure 4.
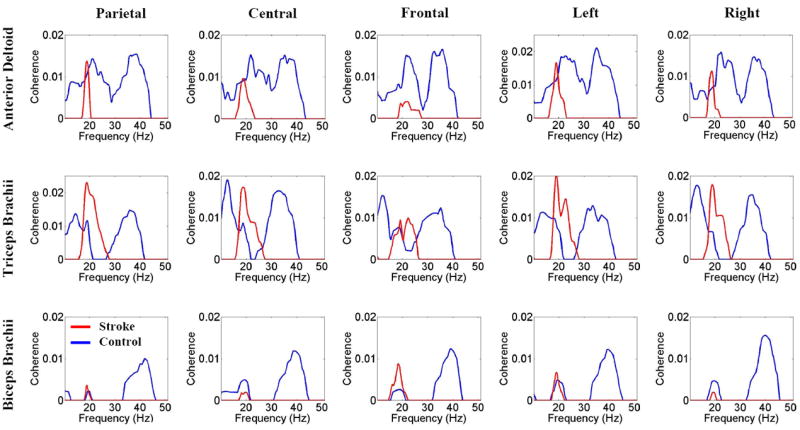
Group-averaged EEG-EMG coherence spectra of stroke patients and controls for the same scalp areas and muscles described in the legend to Figure 1B. Blue lines indicate for controls and red lines mean stroke patients. The spectra were calculated based on EEG and EMG signals from -0.5 to 4.0 s, corresponding roughly from the beginning to the end of the reaching movement. The figure shows no coherence peak at gamma frequency (>30 Hz) in stroke patients. For a majority of the area EEG and muscle EMG combinations, stroke patients had lower coherence at beta frequency (<30 Hz) with a narrower peak, especially for the AD muscle.