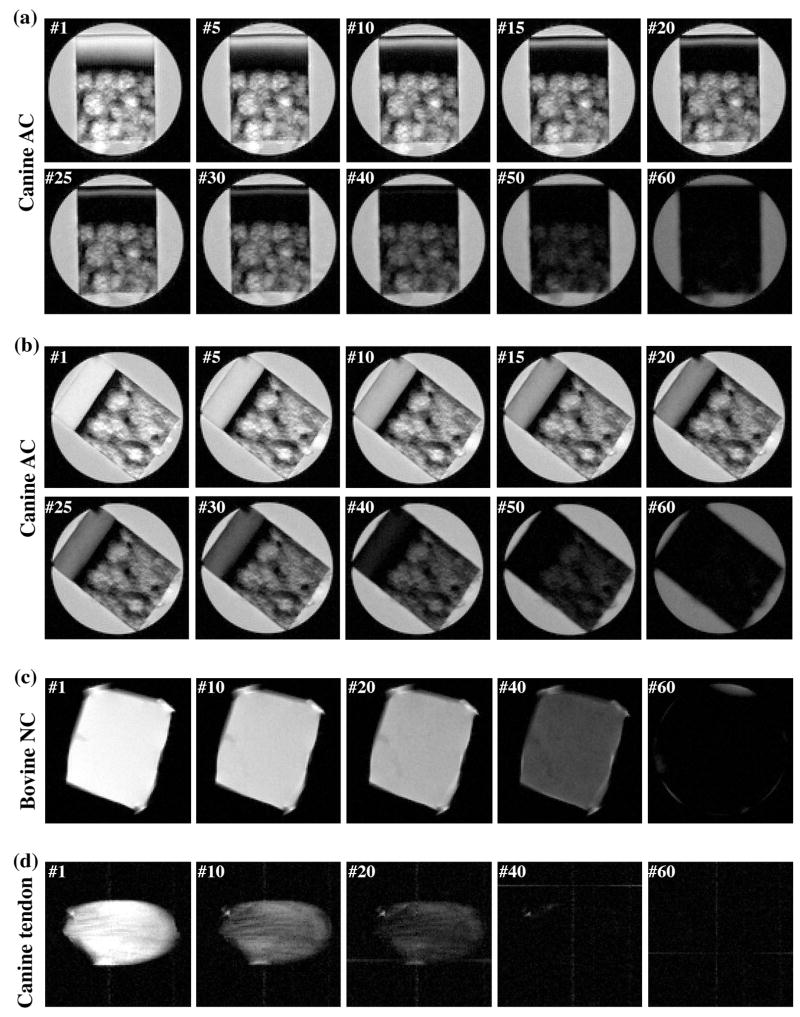
Fig 2.
Selected proton images from the μMRI experiments where each experiment had 60 proton images with different T2 weightings, (a) a block of canine articular cartilage at 0° orientation, (b) a block of canine articular cartilage at the magic angle (55°), (c) a block of bovine nasal cartilage, and (d) a block of canine tendon. All images were displayed using the same minimum and maximum values. (AC: articular cartilage; NC: nasal cartilage)

