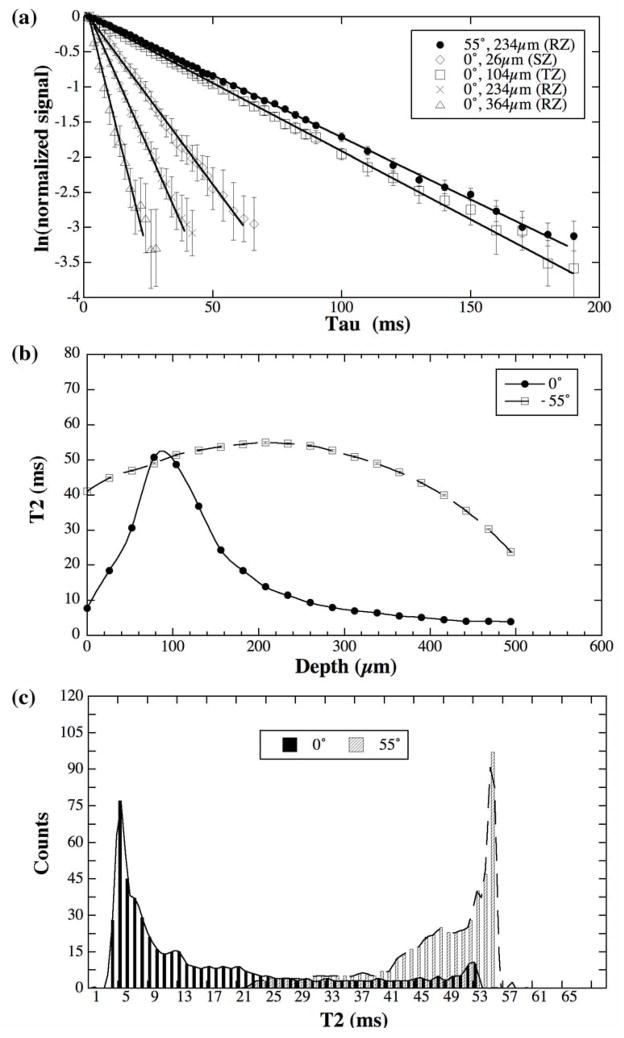
Fig 4.
Fresh canine articular cartilage data from the 60-image μMRI experiments. (a) The natural log plots of the μMRI data of healthy canine articular cartilage, where each plot was from a single pixel location at different zones in articular cartilage. (b) The depth dependent T2 profiles in healthy articular cartilage at 0° and 55°, where each point was calculated individually using the NNLS algorithm. (c) The histograms of the T2 distribution in healthy cartilage based on the interpolated T2 profiles shown in (b). (Note that some error bars, which have been plotted in (a) and (b), are within the symbols.)

