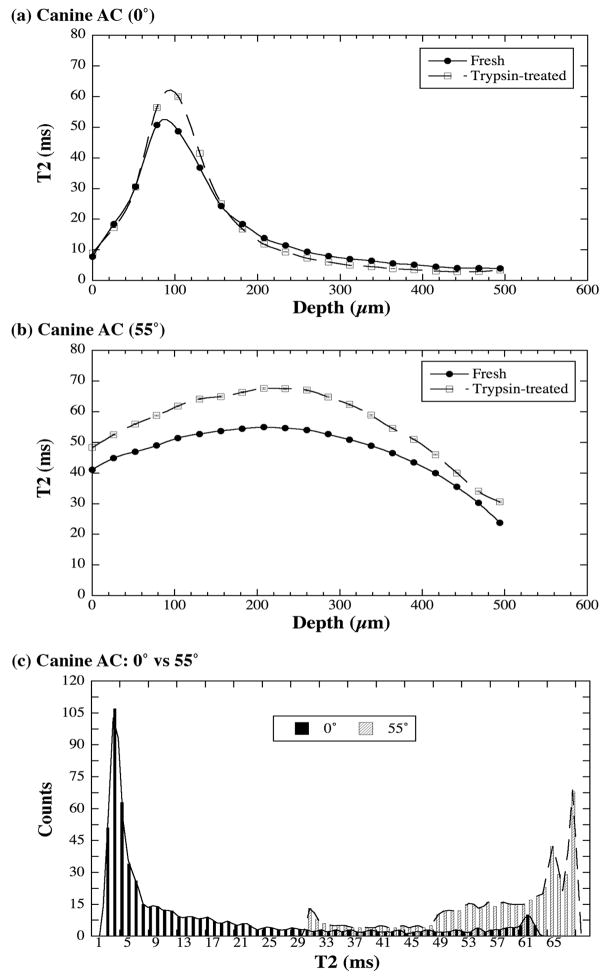
Fig 5.
Trypsin-treated canine articular cartilage data from the 60-image μMRI experiments. The comparisons between the T2 profiles of fresh and trypsin-treated cartilage were shown in (a) and (b). (c) The histograms of the T2 distribution in trypsin-treated cartilage based on their interpolated T2 profiles, which show the increased T2 values in the GAG-depleted cartilage. (The error bars have been plotted in (a) and (b).)

