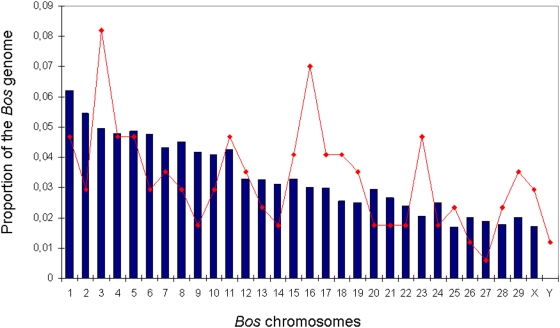
Figure 2. The proportion of the Bos genome contained on each chromosome (blue bars) is shown with the proportion of Myotragus sequences (red line) aligning to each Bos chromosome with exactly 1 hit with e-value<1e-3 BLAST.
The observed distribution is not significantly different from the expected one when we compare all the chromosomes together (P = 0.081) or when we tested each one independently and correct for multiple testing.

