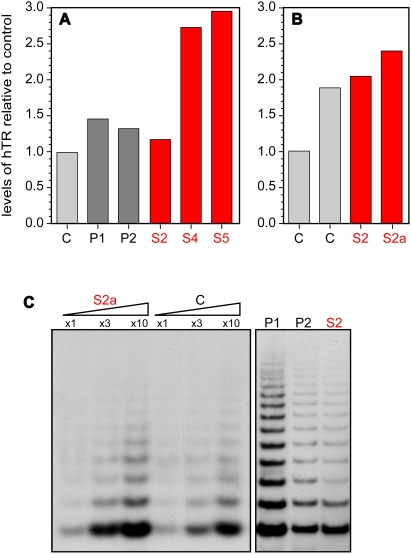
Figure 4. The HHS-affected cells express normal hTR levels and assemble active telomerase.
Total RNA was prepared from blood leukocytes (A) and LCLs (B) derived from the affected siblings (red), unaffected parents (dark gray), or unaffected individuals (C – control; light gray). (A,B) hTR levels were measured by SYBR-green real-time RT-PCR, normalized to the levels of the U93 small nucleolar RNA, and presented as values relative to the controls. S2a indicates a later passage of the S2 LCL. Normalization to the levels of glyceraldehyde-3-phosphate dehydrogenase (GAPDH) mRNA did not significantly change the results (data not shown). (C) Whole-cell extracts were prepared from LCLs and assayed for telomerase activity by TRAP assay, as described in the Materials and Methods. The amounts of the extracts used in total protein were 10, 30, and 100 ng for the left panel, and 100 ng for the right panel. The PDL of the LCLs at which the samples were taken are: S2a, 38; C, 40; P1, 20; P2, 28; and S2, 25.

