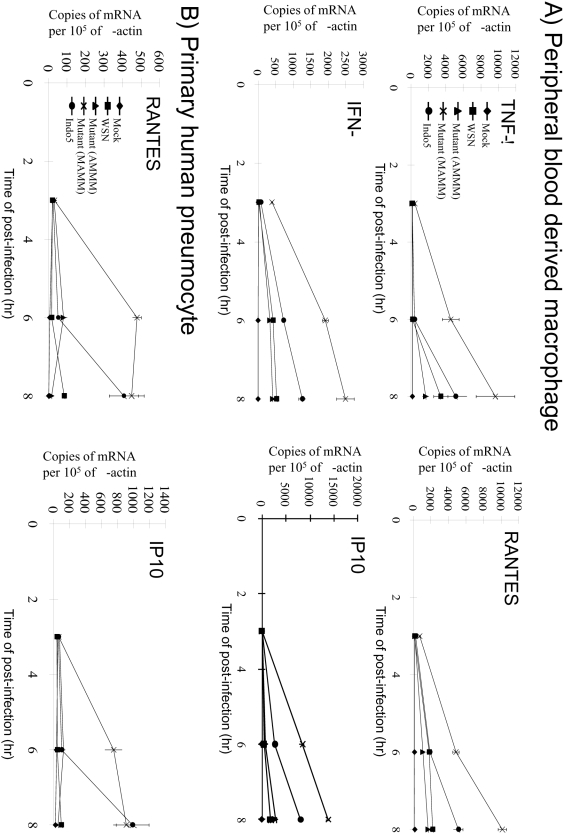
Figure 5. Cytokine and chemokine gene expression profiles (mean±SE) from primary human macrophages (A) and pneuomocytes (B).
Total RNA from cells infected at a MOI of 2 was harvested at the indicated time points and tested by the corresponding quantitative RT-PCR assays as indicated. The data were the averages of triplicate assays. The recombinant viruses used in the experiments were as shown.

