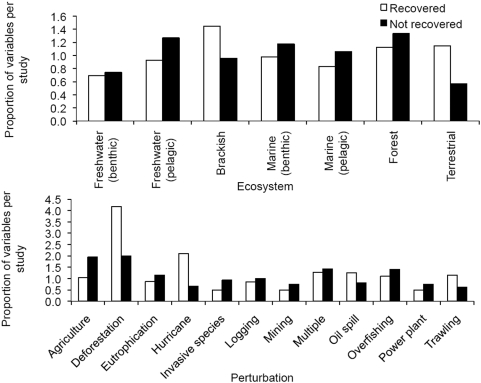
Figure 1. Proportion of variables per study that had recovered (white) versus variables that had not recovered (black) separated by ecosystem type (top) and perturbation type (bottom).
We scaled the studies on a per study basis to avoid biasing our results toward ecosystems or perturbation types with higher representation (see text). Proportions are greater than one as a result of single studies having more than one response variable. Higher proportions indicate a higher incidence of recovery (white) or non-recovery (black). We found no significant differences between any of the paired variables, indicating an equal likelihood of recovery or not for all variables. These are conservative estimates of recovery likelihood as we excluded any variables that were headed towards recovery but had not yet fully recovered.

