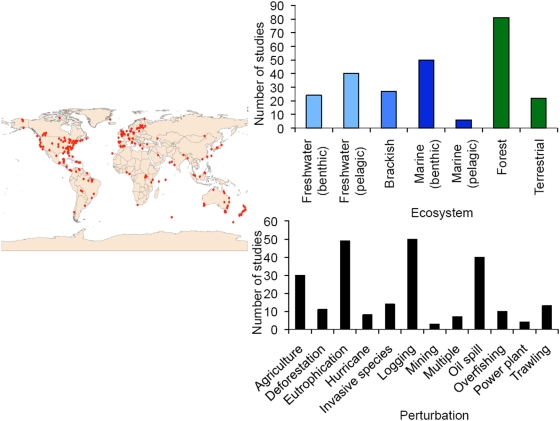
Figure 3. Geographic locations of the 240 studies used in the synthesis of ecosystem recovery (left).
The number of studies in each ecosystem type (top right) and perturbation type (bottom right). The synthesis shows a high representation of studies across various biomes throughout the globe. Some ecosystem and disturbance types were more highly represented than others in the literature, as indicated by both graphs on the right. Colors represent the spectrum of aquatic to terrestrial ecosystems.

