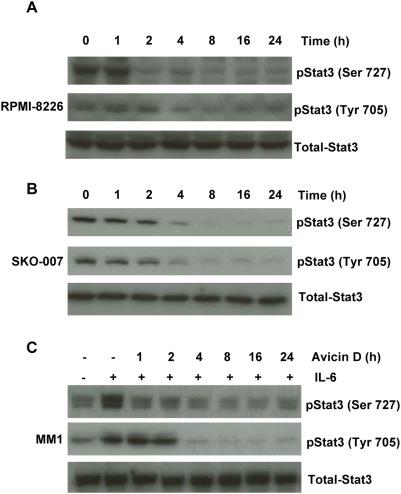
Figure 2. Avicin D dephosphorylates both constitutive and induced Stat3 in myeloma cell lines.
(A) RPMI-8226, (B) SKO-007 and (C) MM1 cells were treated with 1 µM of avicin D for 0–24 hrs. At the end of the avicin D treatment, MM1 cells were additionally exposed to IL-6 (10 ng/ml, 30 min). Whole cell lysates were analyzed for phospho-Stat3 (Ser 727 and Tyr 705) and total Stat3 expression by Western blot analysis as described in the methods.

