
Figure 2.
Linkage Analysis, Expression Studies, and Mutation Analysis
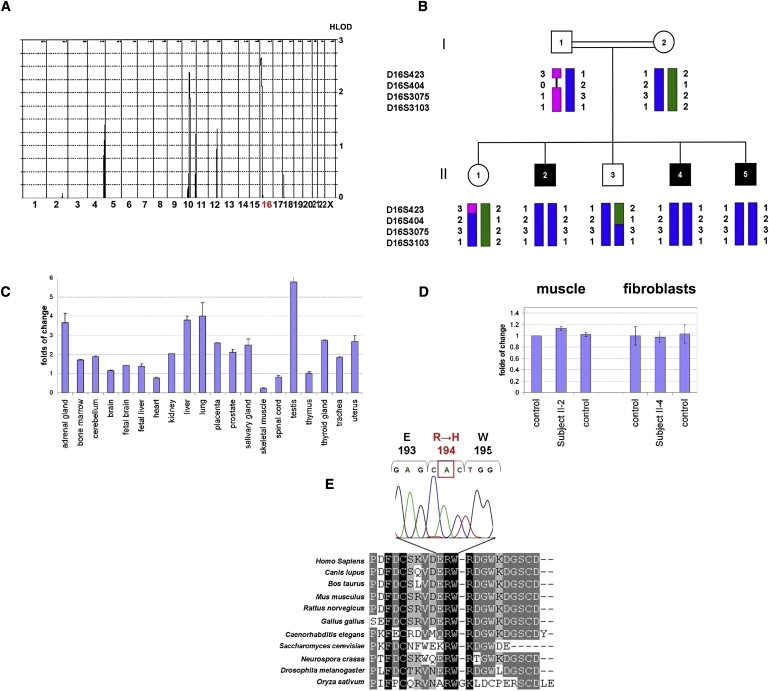
(A) Multipoint linkage analysis of the genome-wide scan with the Affymetrix GeneChip Human Mapping 50K Array Xba240.
(B) Family pedigree and haplotype analysis of the GFER locus. Affected individuals are indicated by black symbols.
(C) Quantitative RT-PCR of GFER expression in 20 human control tissues. GAPDH was used as the control housekeeping gene. The thymus mRNA level was used for normalization of the expression data. All determinations have been performed in replicates (n = 6).
(D) Quantitative RT-PCR of GFER expression in muscle and fibroblasts from patients and controls. Results are presented as mean ± SD.
(E) CLUSTALW multiple-alignment sequence of the GFER region containing the mutated residue in our family. The electropherogram of the c.581 G→A mutation in exon 3 of GFER, resulting in a p.R194H substitution, is shown above.