
Figure 5.
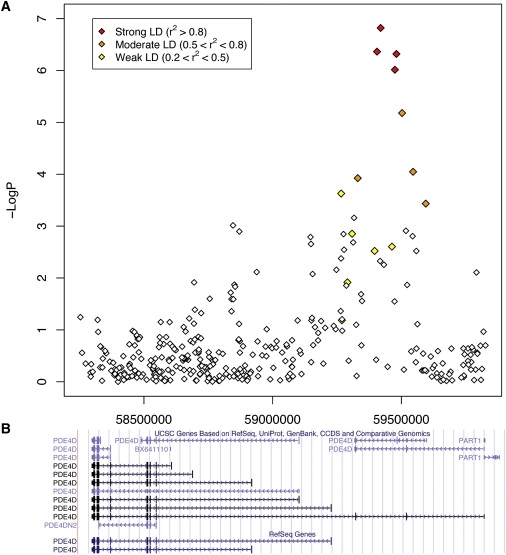
Region of Association of PDE4D SNPs to Asthma in CAMP/Illumina GWAS
(A) The x axis denotes the position along chromosome 5. The y axis denotes –Log10(P), corresponding to allelic p values. LD between the SNP with the lowest p value (rs1544791) to each SNP in the plot is denoted in colors (red, strong LD; orange, moderate LD; and yellow, weak LD).
(B) Corresponding location of genomic sequences available in the UCSC genome browser.