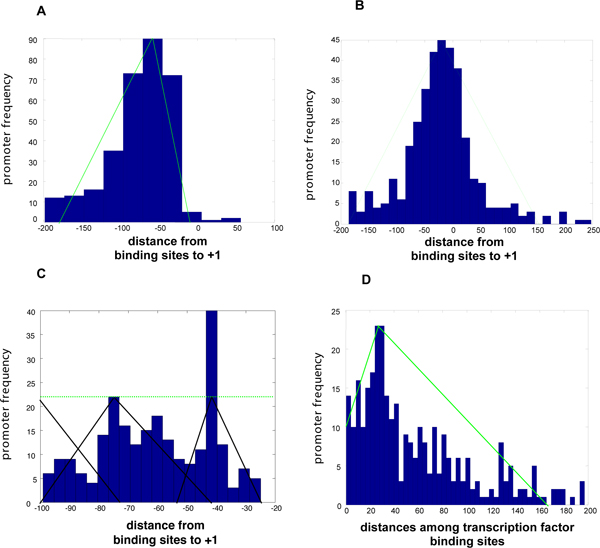
Figure 3.
Learning promoter features. Promoter features were learned as models from examples in databases (e.g., RegulonDB) and then used to describe the intergenic regions of the E. coli and S. enterica genomes. (A, B) Promoters were classified into activated (A), repressed (B) or both, based on the location and the distance of a regulatory protein binding site to the RNA polymerase site. Different distributions are observed for activated, repressed and activated/repressed genes. The property that characterizes activated genes was learned from distances between the transcription start sites (+1) and the binding sites of different transcription factors. These distances were grouped in histograms and codified as elastic (fuzzy) functions, which can be interpreted as the membership degrees (in a unit interval) by which subsets of the dataset can embrace this property. (B) The histogram and membership function corresponding to repressed promoters. μ is maximal at much closer distances. Thus, the promoter distances can be probabilistically interpreted as the posterior probability p(close/activated) that given an activated gene, the regulator binding site is at a close distance from the transcription start site, following Bayes' rule. (C) The distances between transcription start sites (+1) and the binding sites of regulators were grouped into a histogram and codified as elastic (fuzzy)unit-interval functions. This process is analogous to fitting data from a parametric or non-parametric distribution and then assigning probabilities of membership to such distributions. We used these models to characterize the relationships between binding sites for the PhoP protein and the RNA polymerase binding site in the genome. Relationships were classified according to their similarity (fuzzy membership) with the prototypes to obtain a similarity vector of expression values. (D) The histogram illustrates the distances for binding sites of different regulators sharing the same promoter regions. The resulting membership functions, which were learned from such distributions, allows evaluating the putative relationship between a transcription factor motif and a PhoP box based both on motif quality and physical location.

