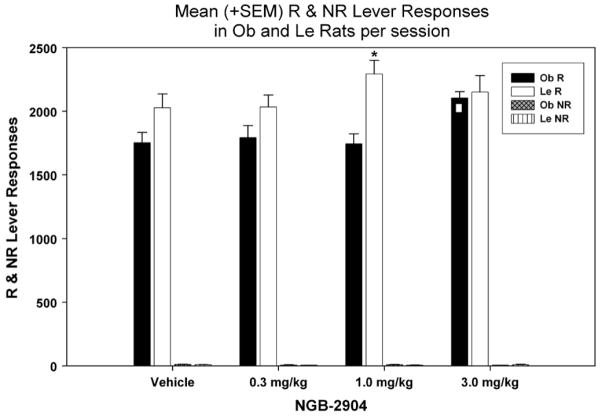
Fig. 4.
Mean (+SEM) number of R (total and during time-out) and NR lever responses per 2-h session, following injection of: vehicle, 0.3, 1, or 3 mg/kg of NGB-2904. □ Denotes significance between specific treatment relative to all others, and * denotes significance between Ob and Le rats at specific dose. The vehicle column data represent the average of the first (baseline), intermittent (between treatments) and last (after the last drug treatment) vehicle sessions.

