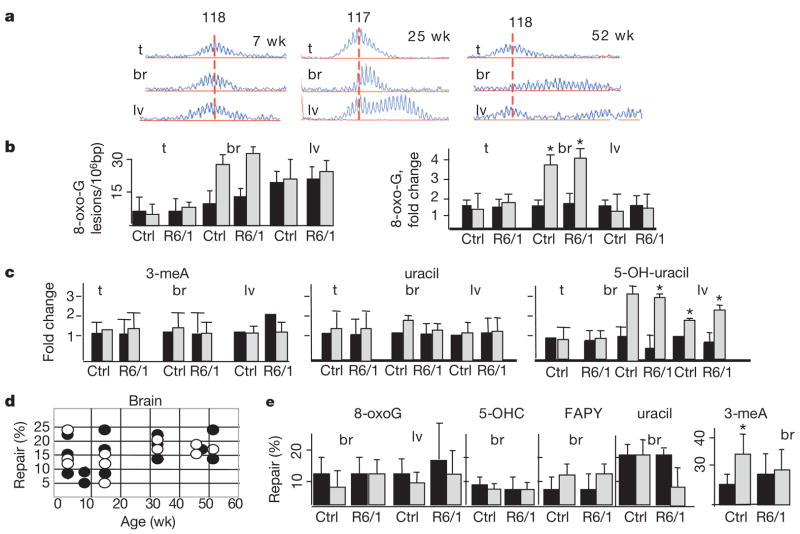
Figure 1. Oxidative lesions accumulate in tissues of ageing mice.
a, Age-dependent CAG repeat distribution in the tissues of R6/1 transgenic mice at indicated ages. The vertical line designates the midpoint length of the CAG repeat distribution in the tail of tested animals. Expansion is an increase in the number of CAG repeats indicated by the shift of distributions to the right (x axis is length in base pairs). b, Left panel, level of oxidative lesions in the tail (t), brain (br) (cortex) and liver (lv) for 8-oxo-G in control (Ctrl) and R6/1 animals at 7 (black) and 52 (grey) weeks. Right panel, accumulation (fold change) of the number of lesions from 7 to 52 weeks. Error bars, s.d. c, Accumulation as in b for 5-OH-uracil, 3-meA and uracil. ★P < 0.01 for b and c. d, Repair activity (Methods) of 8-oxo-G DNA lesion in R6/1 animals (black circles) and wild-type littermate control (open circles) does not change with age (weeks) e, Quantified repair activity (%) of 8-oxo-G, 5-OHC, 3-meA, FAPY and uracil as in d for the indicated tissues at 7 (black) and 52 (grey) weeks. Reported are the mean repair activity (%) and the s.d. The limit of the s.d. is 50 (3-meA).

