Figure 3.
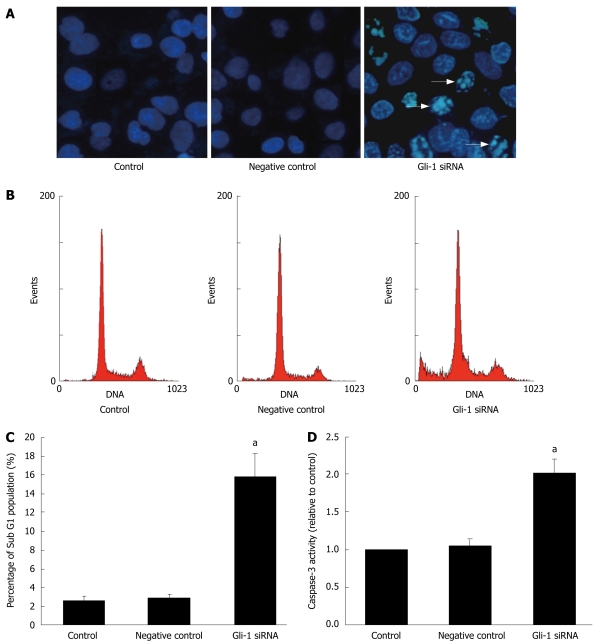
Gli-1 siRNA induced apoptosis in Huh7 cells. Huh7 cells were treated with Gli-1 siRNA for 48 h. A: Morphologic changes characteristic of apoptosis. The samples were stained with Hoechst 33 258 (5 mg/L) for 10 min and photographed using fluorescence microscopy; B: Gli-1 SiRNA induced apoptosis as measured by propidium iodide using a flow cytometry analysis. After treatment, the nuclei were stained with propidium iodide and analyzed by flow cytometry. Representative frequency distributions of DNA content of cells in the three treatment groups were shown; C: The bar chart showed the percentage of cells in the sub-G1 apoptotic fraction. The treatment groups were labeled on the horizontal axis. The error bars represented the standard deviation; D: Gli-1 siRNA induced activation of caspase-3. The activity of caspase-3 was assessed by caspase colorimetric assay. The data were showed as mean ± SD of 3 independent experiments. (aP < 0.05 vs control).

