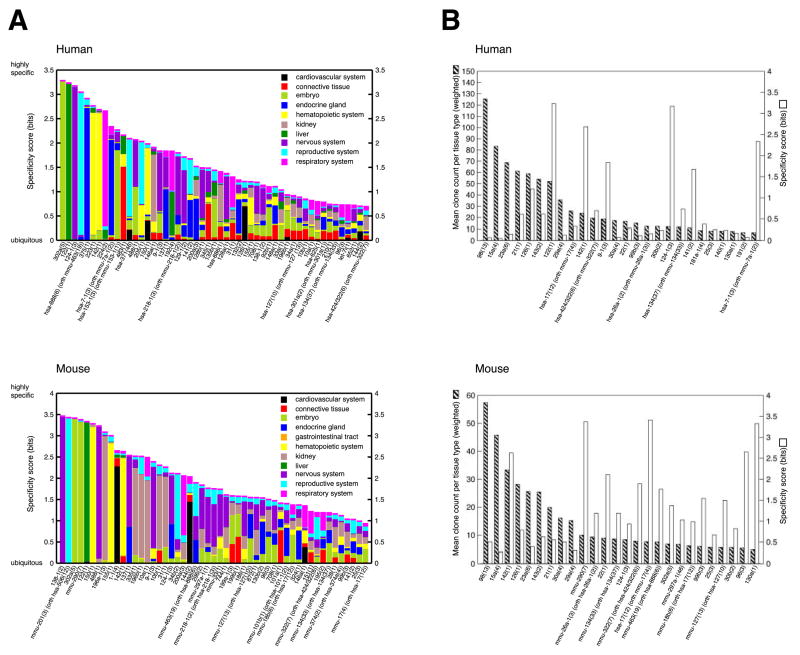
Figure 2. Tissue specificity of miRNA expression.
(A) The 51 most specific miRNA precursor clusters for human and mouse are depicted. The total height of each bar represents the information content reflecting tissue specificity, while the relative heights for each of the tissues are proportional to the clones of a miRNA precursor cluster in a given tissue type relative to all tissue types. The enrichment of miR-124 in the endocrine tissue in mouse is due to high expression of this miRNA in the MIN-6 beta-cell line, but miR-124 is not expressed in primary β-cells residing in mouse or human islets. (B) The 26 most expressed miRNA precursor clusters for human and mouse are depicted. The mean clone count for each tissue type (striped bars) and the tissue specificity (white bars) are indicated. The most abundant miRNA clusters are ubiquitously expressed and show little tissue specificity.

