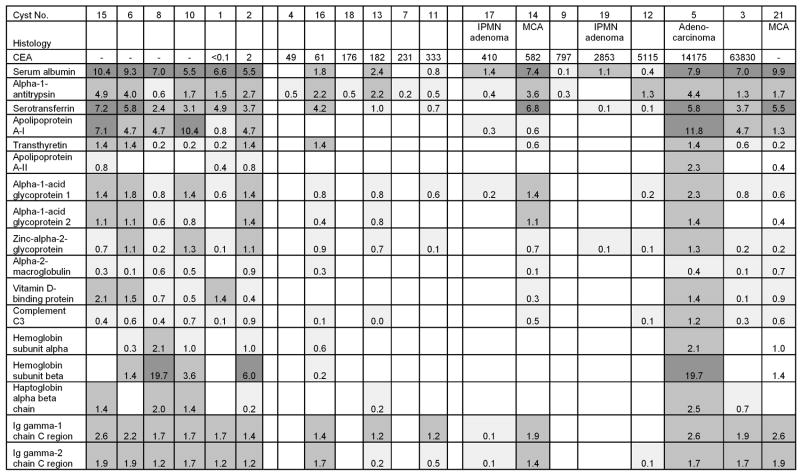
Figure 3. Representatives of 137 plasma proteins distributed among the pancreatic cyst samples.
The numbers shown are emPAI roughly proportional to protein abundance. Dark (>1), medium (0.1 to 1), and light (<0.1) shading denotes relative protein abundance. No proteins were detected for the empty boxes. CEA = ng/mL. MCA=mucinous cystadenoma

