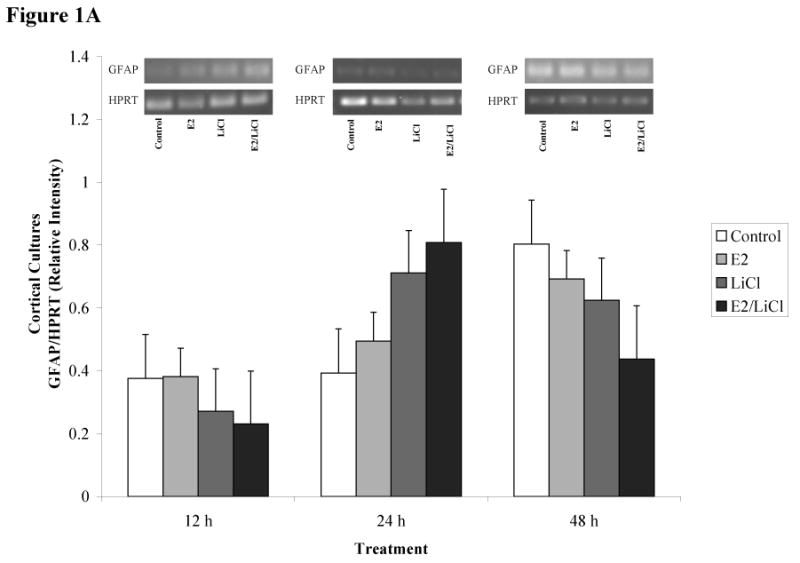
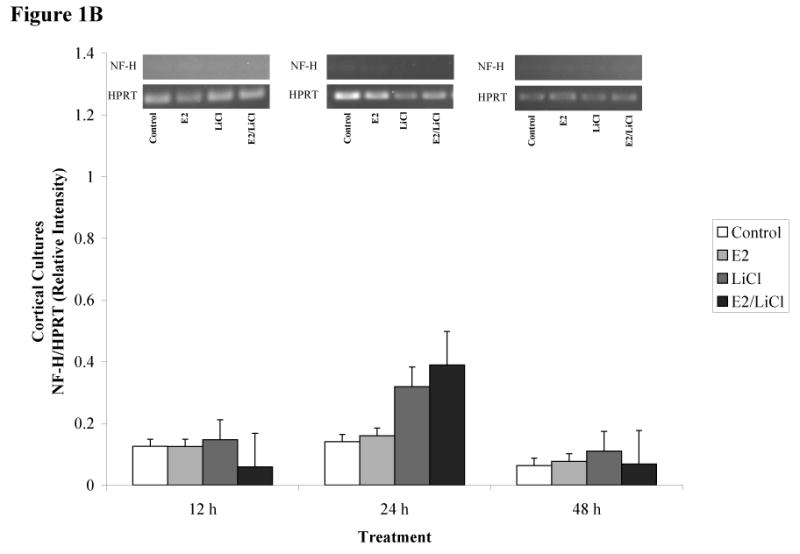
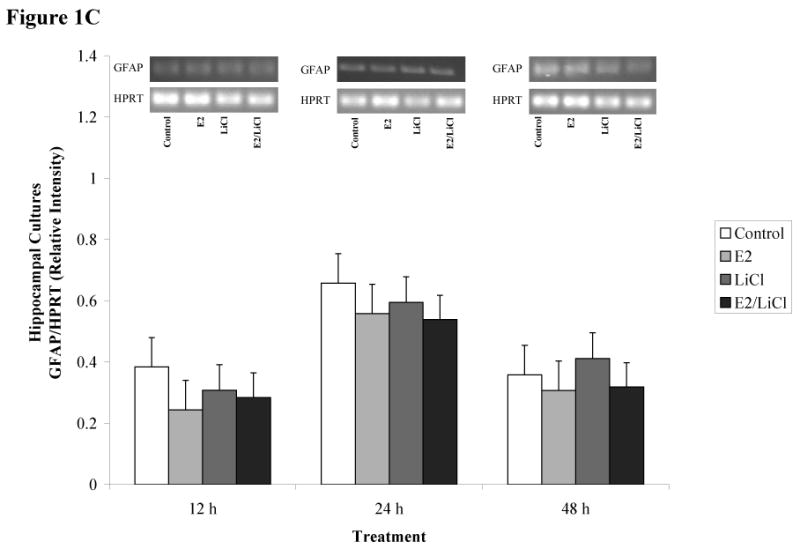
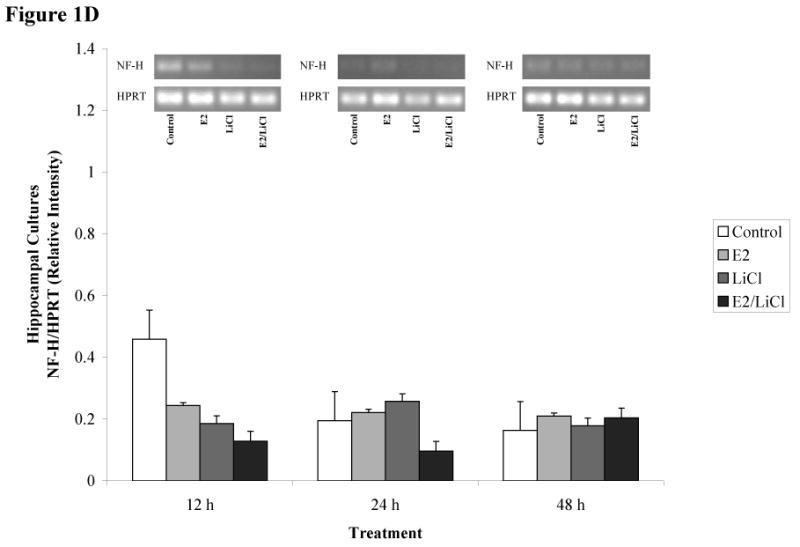
Figures 1 A-D.


ImageJ densitometric data obtained from RT-PCR and electrophoresis. Analysis was performed via electrophoresis of RT-PCR samples using a 1.5% agarose gel, gel images captured, and analyzed using ImageJ. Low visibilities of bands are due to low mRNA expression. Total RNA from and reverse transcribed E18.5 cortical (A & B) and hippocampal (C & D) primary cell cultures were isolated from Control (no treatment), 0.04μM E2, 10mM LiCl, and combined E2/LiCl treated for 12, 24, and 48 h. cDNA was then amplified via PCR using gene specific primers for GFAP (A & C) or NF-H (B & D). Measurements were based on relative pixel intensity (integrated intensity of GFAP/HPRT or NF-H/HPRT) and expressed in arbitrary units. Gels are represented for each gene and treatment period (represented above the graph).
