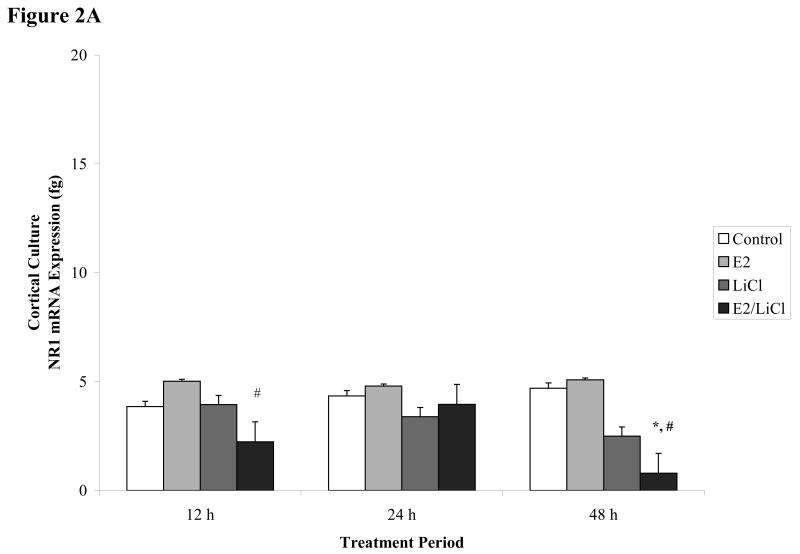
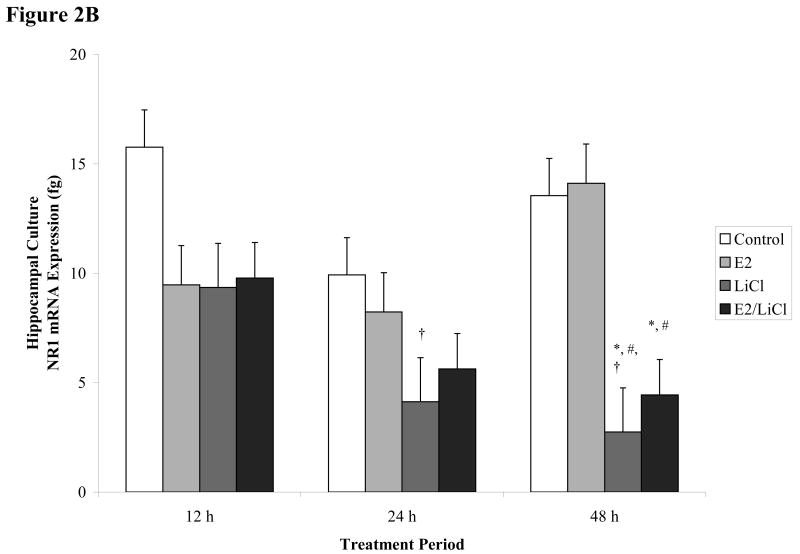
Figures 2 A-B.
Real time RT-PCR of NR1 mRNA expression. E18.5 cortical (A) and hippocampal (B) primary cell cultures treated for 12, 24, and 48 h with 0.04μM E2, 10mM LiCl, combined E2/LiCl, or Control (no treatment). After temporal treatment total RNA was isolated and reverse transcribed. The figure denotes NR1 mRNA expression in femtograms (y-axis) and treatment duration (x-axis). *, p-value < .05 compared with control; #, p-value < .05 compared with E2; †, p-value < .001 compared with 12 h treatment.


