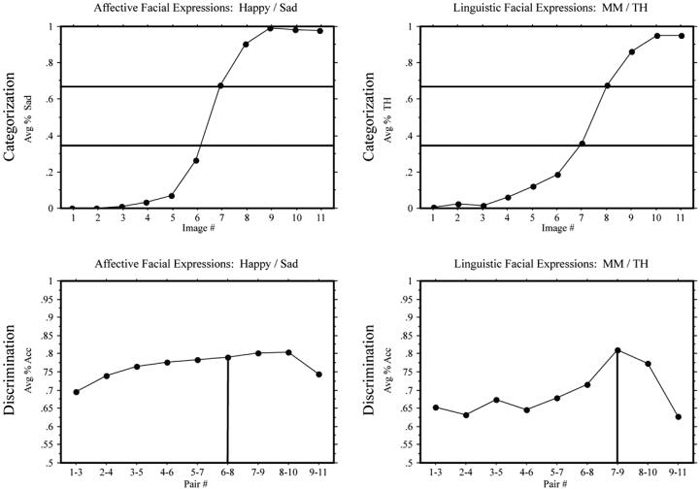
Fig. 8.
Experiment 2: Deaf participants. Top: mean response percentages for the identification tasks: percentage “sad” responses in the (happy/sad) continuum and percentage “TH” responses in the (MM/TH) continuum. The horizontal lines indicate 33% and 66% boundaries. Bottom: means of accuracy in the discrimination tasks; the vertical lines indicate the predicted peaks in accuracy.

