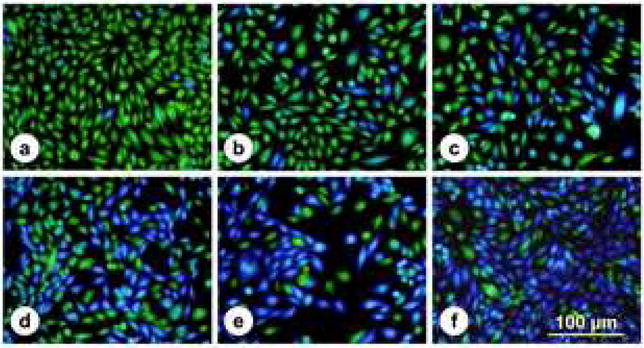
Fig. 1. Fluorescence micrographs of NFAT-bla CHO-K1 cells with PMT-induced β-lactamase expression.

NFAT-bla CHO-K1 cells were grown in 96-well plates and incubated for 16 h with medium or stimulated with increasing doses of PMT: (a) 0, (b) 0.065 nM (10 ng/ml), (c) 0.65 nM (100 ng/ml), (d) 3.25 nM (500 ng/ml), (e) 6.5 nM (1,000 ng/ml), or with (f) 10 nM thapsigargin as a positive control for maximal cellular response. Cells were loaded with CCF4/AM for 2 h at room temperature and visualized by fluorescence microscopy. Non-stimulated cells appeared green and stimulated cells appeared blue. Bar, 100 βm.
