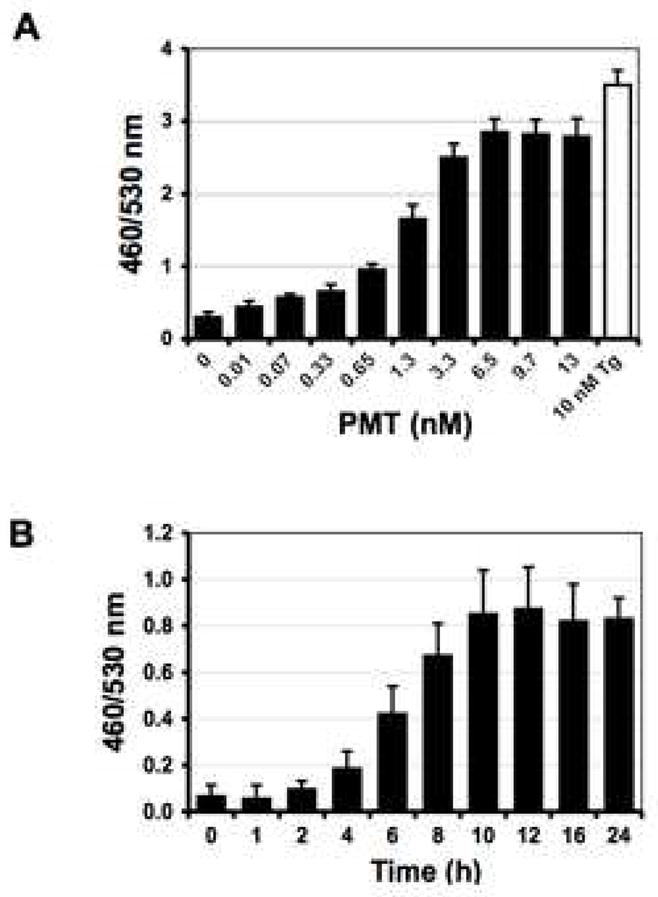
Fig. 2. Dose and time course responses of NFAT-bla CHO-K1 Cells to PMT treatment.

A) Shown is the dose response after 16 h of incubation with the indicated concentrations of PMT at 37°C. Cells were loaded with CCF4/AM for 2 h at room temperature and analyzed by fluorescence microplate reader with excitation at 405 nm and emission at 460 and 530 nm using bottom-read mode. Data were plotted as 460/530 nm ratios versus the concentration of PMT. The EC50 value of PMT determined using this assay was 1.3 nM. B) Shown is a time course of the response to PMT treatment in NFAT-bla CHO-K1 cells. Cells were treated with 0.65 nM PMT at 37°C. At the indicated times, cells were analyzed as described in (A).
