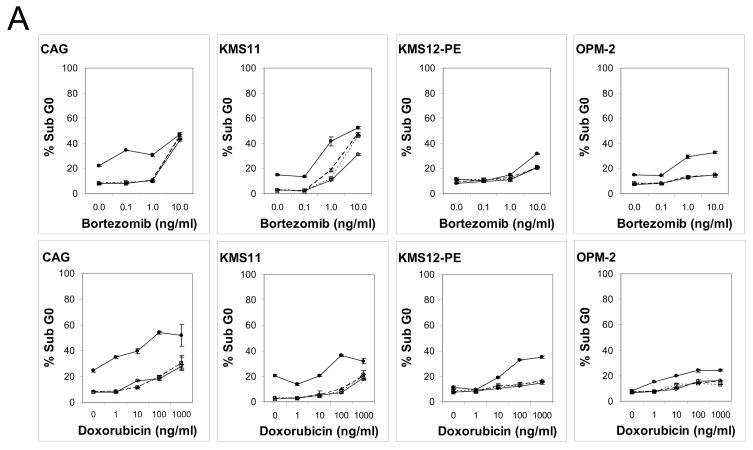
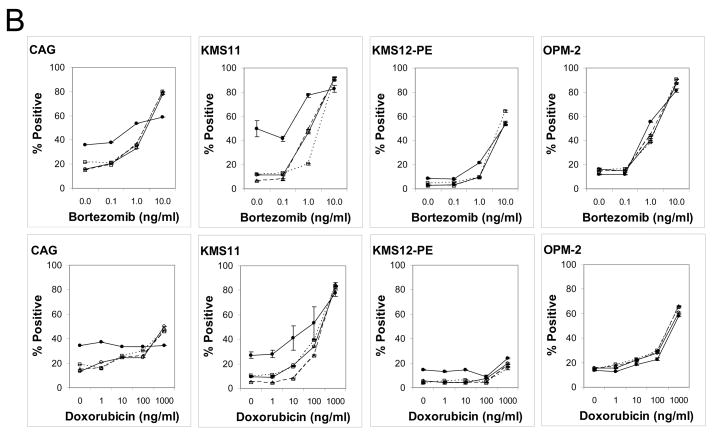
Figure 3. Apoptotic effect of mAbs on MM cell lines.
Induction of apoptosis was evaluated by flow cytometry determination of (A) hypodiploid DNA and (B) activated caspase-3. Cells were incubated with drugs alone, milatuzumab alone, or combinations of drug + milatuzumab with and without a second antibody for cross-linking for 48 h. For determination of hypodiploid DNA, staining was done with propidium iodide. Changes in the intracellular levels of cleaved caspase-3 were measured using FITC–conjugated rabbit anti-activated caspase-3. Analyses were performed on the FACSCalibur. ○, solid line, drug only; △, dashed line, drug + milatuzumab; □, dotted line, drug + GAH; ●, solid line, drug + milatuzumab + GAH. Error bars represent standard deviations of 3 replicates, and at some points are hidden by the symbol.


