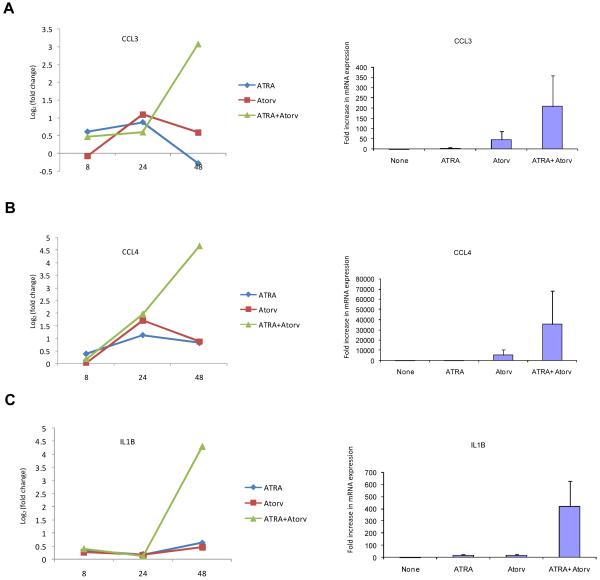
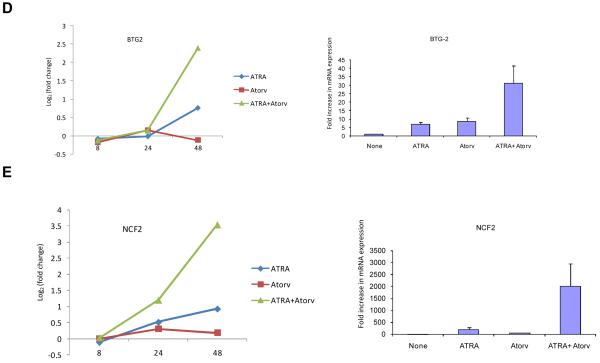
Figure 4.
Synergistic effect of ATRA and atorvastatin on gene expression. NB4 cells were treated for 8, 24 and 48 hrs with ATRA (0.5μM), atorvastatin (2μM), or the combination of ATRA and atorvastatin, as indicated. Patterns of gene expression for CCL3 (A, left panel), CCL4 (B, left panel), IL1B (C, left panel), BTG2 (D, left panel), and NCF2 (E, left panel) were investigated using Illumina Sentrix Human-6 Expression BeadChips. Three independent microarray experiments were performed and 2 steps regression strategy was applied as statistical analysis. Expression of mRNA for CCL3 (A, right panel), CCL4 (B, right panel), IL1B (C, right panel), BTG2 (D, right panel), and NCF2 (E, right panel) were evaluated by quantitative real time RT-PCR (TaqMan). GAPDH was used for normalization. Data are expressed as fold increase over untreated samples and represent means ± S.E. of 3 independent experiments.


