
Figure 3.
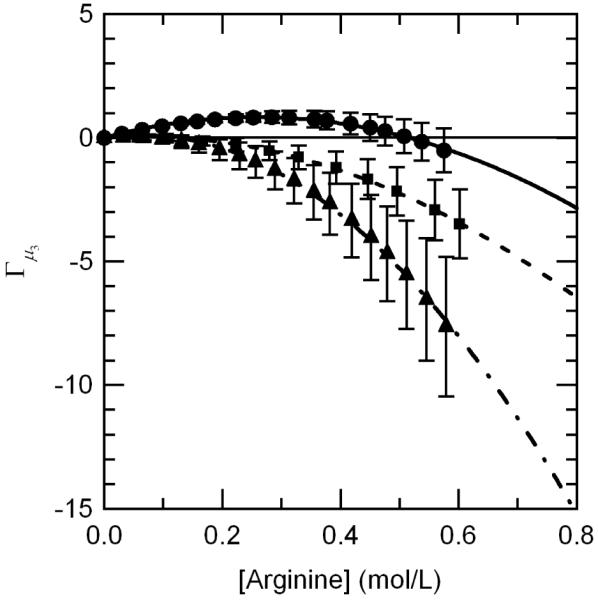
Comparison of arginine preferential interaction coefficient values for all three proteins tested demonstrating the relationship with arginine concentration and protein size; lysozyme, 14.3 kDa (●), aCgn, 25.7 kDa (■), and BSA, 66.4 kDa (▲).