
Fig. 3.
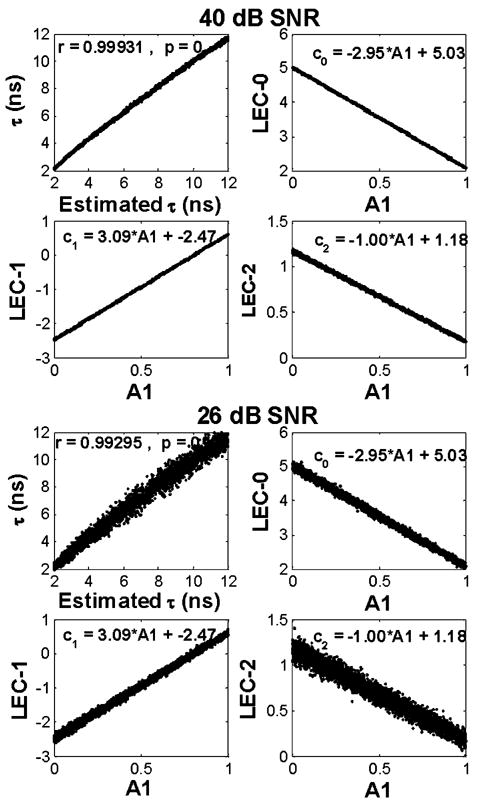
Synthetic images. Correlation between synthetic and estimated lifetimes; and the linear relations between the LECs and the intensity ratio A1 of the two underlying lifetime components. Top panels: 40-dB images. Bottom panels: 26-dB images. The equations correspond to the least-square solution of a linear fitting to the LEC versus A1 data.