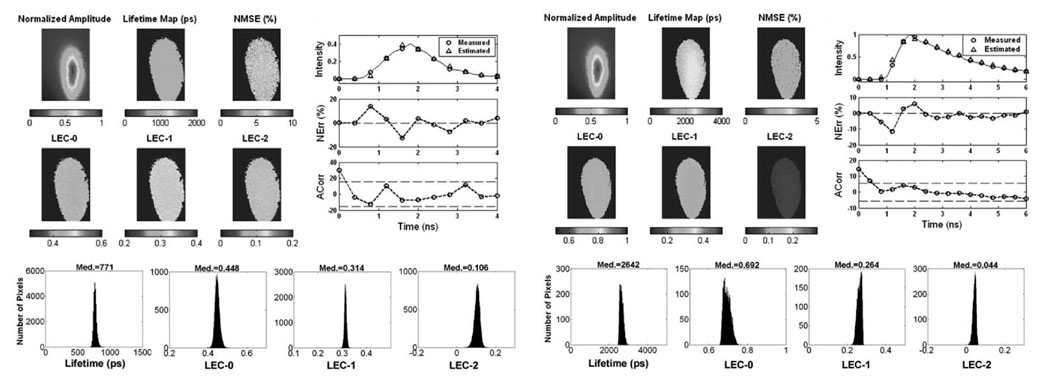
Fig. 5.
Results of the analysis of FLIM images from Rose Bengal in ethanol (Upper panels). Color panels: maps of normalized intensity values, lifetimes, NMSE, and normalized LECs. The bar-scales on the bottom of the maps show the range of values on the maps. Upper right panels: measured and estimated decays corresponding to a sample pixel of the image and the corresponding NErr and Acorr. Bottom panels: map histograms indicating the distribution of lifetime and LECs values in the image. Results of the analysis of FLIM images from Rhodamin B in ethanol are also shown below.

