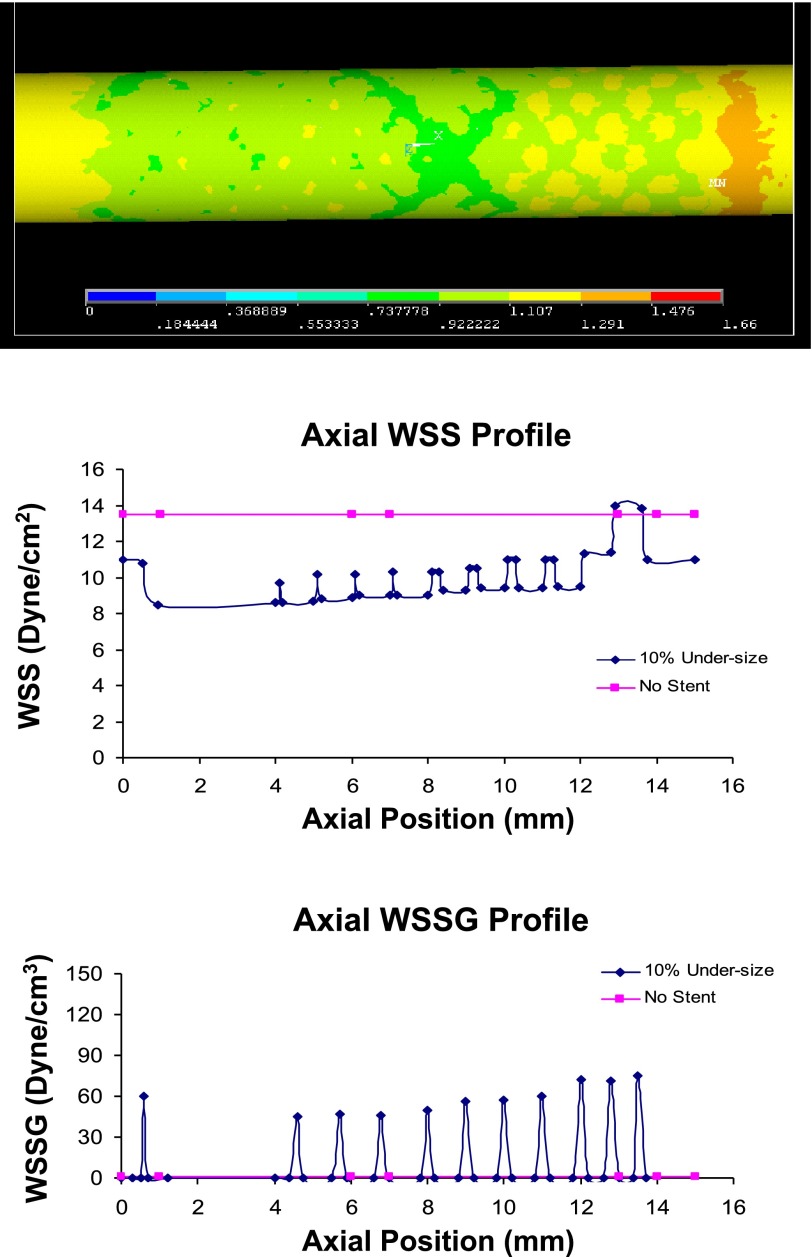
Fig. 3.
Top: WSS distribution (Pa) with 10% undersized stent (frontal view of 3D model). The proximal entrance region has lower WSS than the distal region. Middle: the WSS. Bottom: WSSG profile in the 10% undersized case. The presence of stent struts lowers the WSS, while elevating the WSSG compared with the no-stent case.

