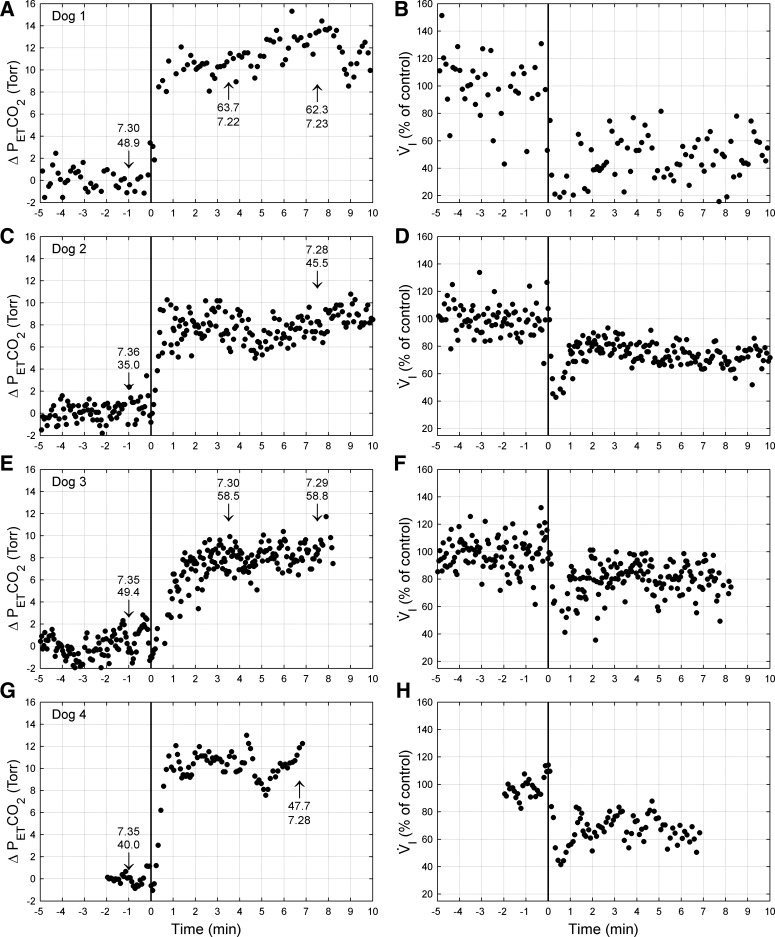
Fig. 2.
PetCO2 (left) and V̇i (right) responses from one representative trial of CB inhibition from each dog: dog 1 (A and B), dog 2 (C and D), dog 3 (E and F), and dog 4 (G and H). Data are breath by breath and normalized to control (endogenous CB perfusion; i.e., CB not inhibited). CB inhibition commenced at time 0 (vertical line). Numbers at arrow indicate arterial Pco2 (Torr) and pH measured at that time. Note that the hypoventilation is maintained throughout CB inhibition, despite marked CO2 retention and arterial acidosis. Δ, Change.

