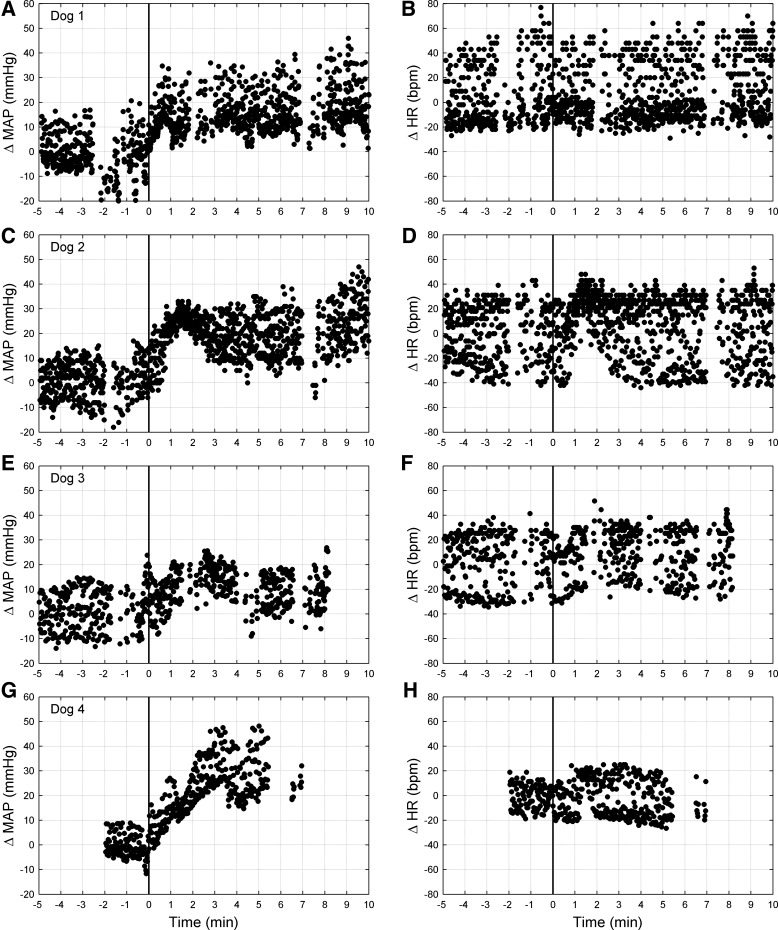
Fig. 5.
Mean arterial pressure (MAP; left) and heart rate (HR; right) responses from one representative trial of CB inhibition from each dog: dog 1 (A and B), dog 2 (C and D), dog 3 (E and F), and dog 4 (G and H). Data are beat by beat and normalized to control (endogenous CB perfusion; i.e., CB not inhibited). CB inhibition commenced at time 0 (solid line). Discontinuities in the data are due to blood sampling, which interrupted pressure measurement. Note the persistent increase in MAP during CB inhibition. bpm, Beats per minute.

