Fig. 2.
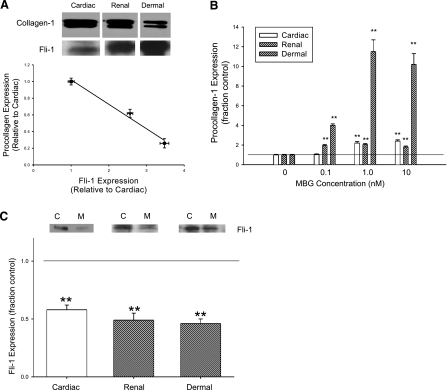
Procollagen and Fli-1 expression in different fibroblasts. A: representative Western blot for procollagen showing dimer detected with polyclonal antibody at ∼150 kDa and Fli-1 detected with a polyclonal antibody at ∼50 kDa (both shown at top) and the quantification of these measurements in each group (n = 6) obtained at baseline in rat cardiac and renal and human dermal fibroblasts grown to confluence (bottom). Regression line for procollagen expression compared with Fli-1 expression is shown with data normalized to that of cardiac fibroblasts (r2 = 0.98, P < 0.01). B: quantitative densitometric data for procollagen (measured by Western blot as in A) in response to different doses of MBG for 24 h (n = 6). C: quantitative densitometric data for Fli-1 (measured by Western blot as in B) obtained in response to 10 nM MBG (n = 6) for 24 h. Because of the differences in basal Fli-1 expression, we loaded 200 μg for cardiac, 130 μg for renal, and 80 μg for dermal fibroblast nuclear extracts. Top: C represents control, and M refers to MBG. Bars on quantitative graphs represent means ± SE. **P < 0.01 vs. control.

