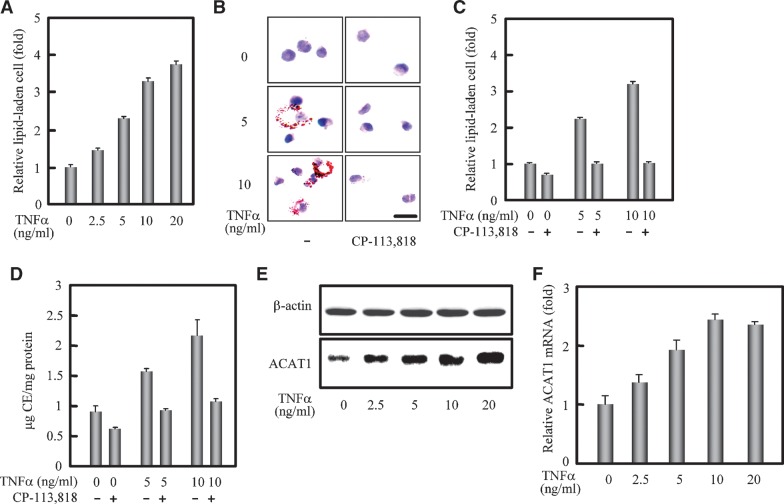
Fig. 1.
Formation of CE-laden cells promoted by TNFα correlates with enhancement of the ACAT1 expression. A: Formation of lipid-laden cells from human blood differentiating monocytes promoted by TNFα. Human blood monocytes were cultured for 48 h, stimulated with different concentrations of TNFα (0, 2.5, 5, 10, and 20 ng/ml) for 40 h, and then incubated with oxLDL (40 μg/ml) for another 48 h without TNFα. Lipid-laden cells (lipid droplet positive cells) were then evaluated. The detailed treatment and evaluation methods are described in “Materials and Methods.” The data represented the means ± SD from 5 fields of cells. B: Blockage of the TNFα-promoting lipid-laden cell formation by ACAT inhibitor. Human blood monocytes were cultured for 48 h, stimulated with different concentrations of TNFα (0, 5, and 10 ng/ml) for 40 h, and then incubated with oxLDL (40 μg/ml) plus the ACAT inhibitor CP-113,818 (8 μM) for another 48 h without TNFα. The detailed treatments and lipid droplet staining are described in “Materials and Methods.” Representative lipid droplet staining images are shown. Scale bar, 20 μm. C: Quantification for blockage of the TNFα-promoting lipid-laden cell formation by ACAT inhibitor. The lipid-laden cells in (B) were quantified and represented as (A). D: Cellular cholesterol assay. The cells were treated as (B) and the contents of total and free cholesterols as well as proteins were measured as described in “Materials and Methods.” The CE content in each condition was obtained from the difference of total and free cholesterol contents. The data shown as the ratio of CE and protein contents (μg CE /mg protein) represented the means ± SD from triplicate determinations. E: Immunoblotting of human ACAT1 protein. Human blood monocytes were cultured for 48 h and stimulated with different concentrations of TNFα for 40 h the same as in (A) but without the oxLDL treatment. Immunoblotting was performed as described in “Materials and Methods.” F: RT-qPCR analysis of human ACAT1 mRNA. Human blood monocytes were cultured and treated the same as in (A). RT-qPCR analysis with the prepared total RNAs and appropriate primers are described in “Materials and Methods.” The content of human ACAT1 mRNA was normalized to that of GAPDH mRNA in each condition. The data shown as the relative ACAT1 mRNA (fold) were calculated from the normalized contents by setting the average content of that without treatment to 1.0, and represented the means ± SD from triplicate determinations. All of the experiments were repeated three times with similar results.

