Fig. 1.
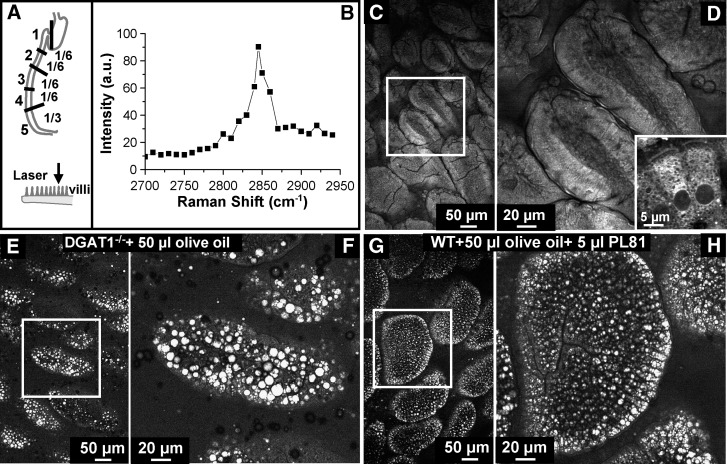
Validation of CARS microscopy for imaging LDs in enterocytes. A: Mouse small intestine was divided into five regions. Tissues from region 2 were cut open longitudinally and imaged in lumen view. B: CARS spectrum of lipids in the small intestine. C, D: CARS image of villi from wide type mice fasted 4 h. A monolayer of enterocytes constitutes the outer layer of each villus, and the microvilli are evident on the apical side of enterocytes. Inset of D shows a CARS image of two enterocytes. The cytoplasmic organelles show a bright contrast due to the abundant CH2 groups in their phospholipid membranes. The nuclei display a dark contrast. E, F: Enterocytes from DGAT1-deficient mice fed 50 μl oil via oral gavage and 3 h after gavage show a high level of LD accumulation with the diameter of LDs up to 9 μm. G, H: Enterocytes from mice fed 50 μl olive oil with 5 μl PL81 via oral gavage and 3 h after gavage show a high level of small LD accumulation. D, F, and H are zoom-in views of the squares in C, E, and G, respectively.

