Fig. 5.
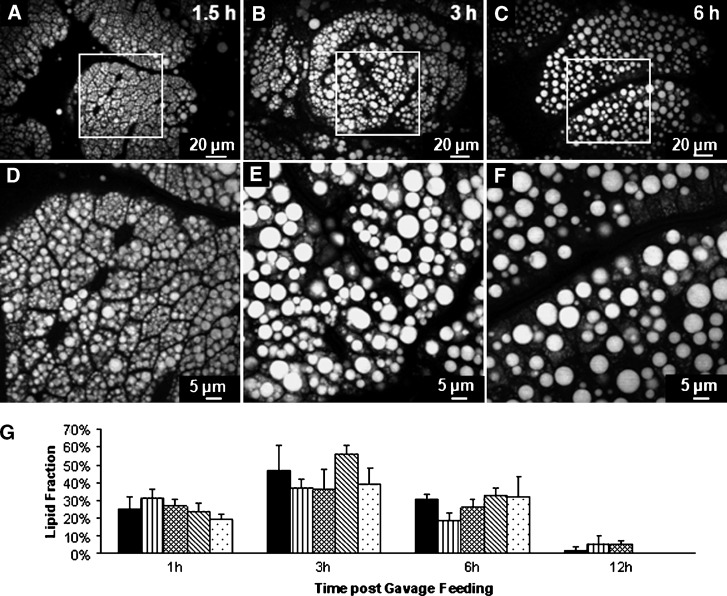
In vivo CARS imaging demonstrates dynamic accumulation and depletion of TG in CLDs during the process of DFA. A, D: At 1.5 h after gavage of 300 μl olive oil, enterocytes were filled with small CLDs with an average diameter of 2.7 μm. B, E: At 3 h after gavage, larger CLDs with an average diameter of 4.4 μm were observed, implying the occurrence of LD fusion. C, F: At 6 h after gavage, compared with the level at 3 h after gavage, the CLD accumulation decreased with an average diameter of 3.5 μm. To estimate the change of lipid size in vivo at different times after gavage feeding, 8,897 LDs at 1.5 h, 3,595 LDs at 3 h, and 1,698 LDs at 6 h were used. D–F are zoom-in views of A–C, respectively. G: Variation of the amount of LDs based on the area of LD in enterocytes with different times after consumption of dietary fat. Ex vivo CARS images of region 2 small intestine tissues were obtained from five mice for 1, 3, and 6 h time points (at least 50 villi total at each time point) and from 3 mice for 12 h time point (40 villi) and analyzed by Image J software.

